Dynatrace: Monitor your Aviatrix Environment
Table of Contents
Description
If you landed here then you must have searched for examples about how you can get Dynatrace to work with Aviatrix.
Worry not…I also searched for those as I’m a pretty lazy person and prefer not to reinvent the wheel if I can avoid it.
I found a VSCode dynatrace plugin that makes things easier but then no premade examples so I went out to try Chat GPT / Gemini AI.
I lost 1h thinking that AI is the holy grail which will save me time and I was proven wrong.
Not a single line of code from it worked. I just ended up being frustrated.
See below what I came up with and how…
Also, to avoid confusion between VSCode and Dynatrace I call:
- plugin the Dynatrace VSCode extension itself (which enables you to write Dynatrace Portal Extensions)
- extension the Dynatrace extensions that get uploaded to their service and are used for gathering metrics and setting up Dynatrace-Aviatrix monitoring
Before we start
If you get lost (like me) on the Dynatrace website and feel overwhelmed by the volume of info available, then for this specific use case I found a great video.
You’ll need about an hour of your time but I really feel it was worth it:
Dynatrace elements - high level
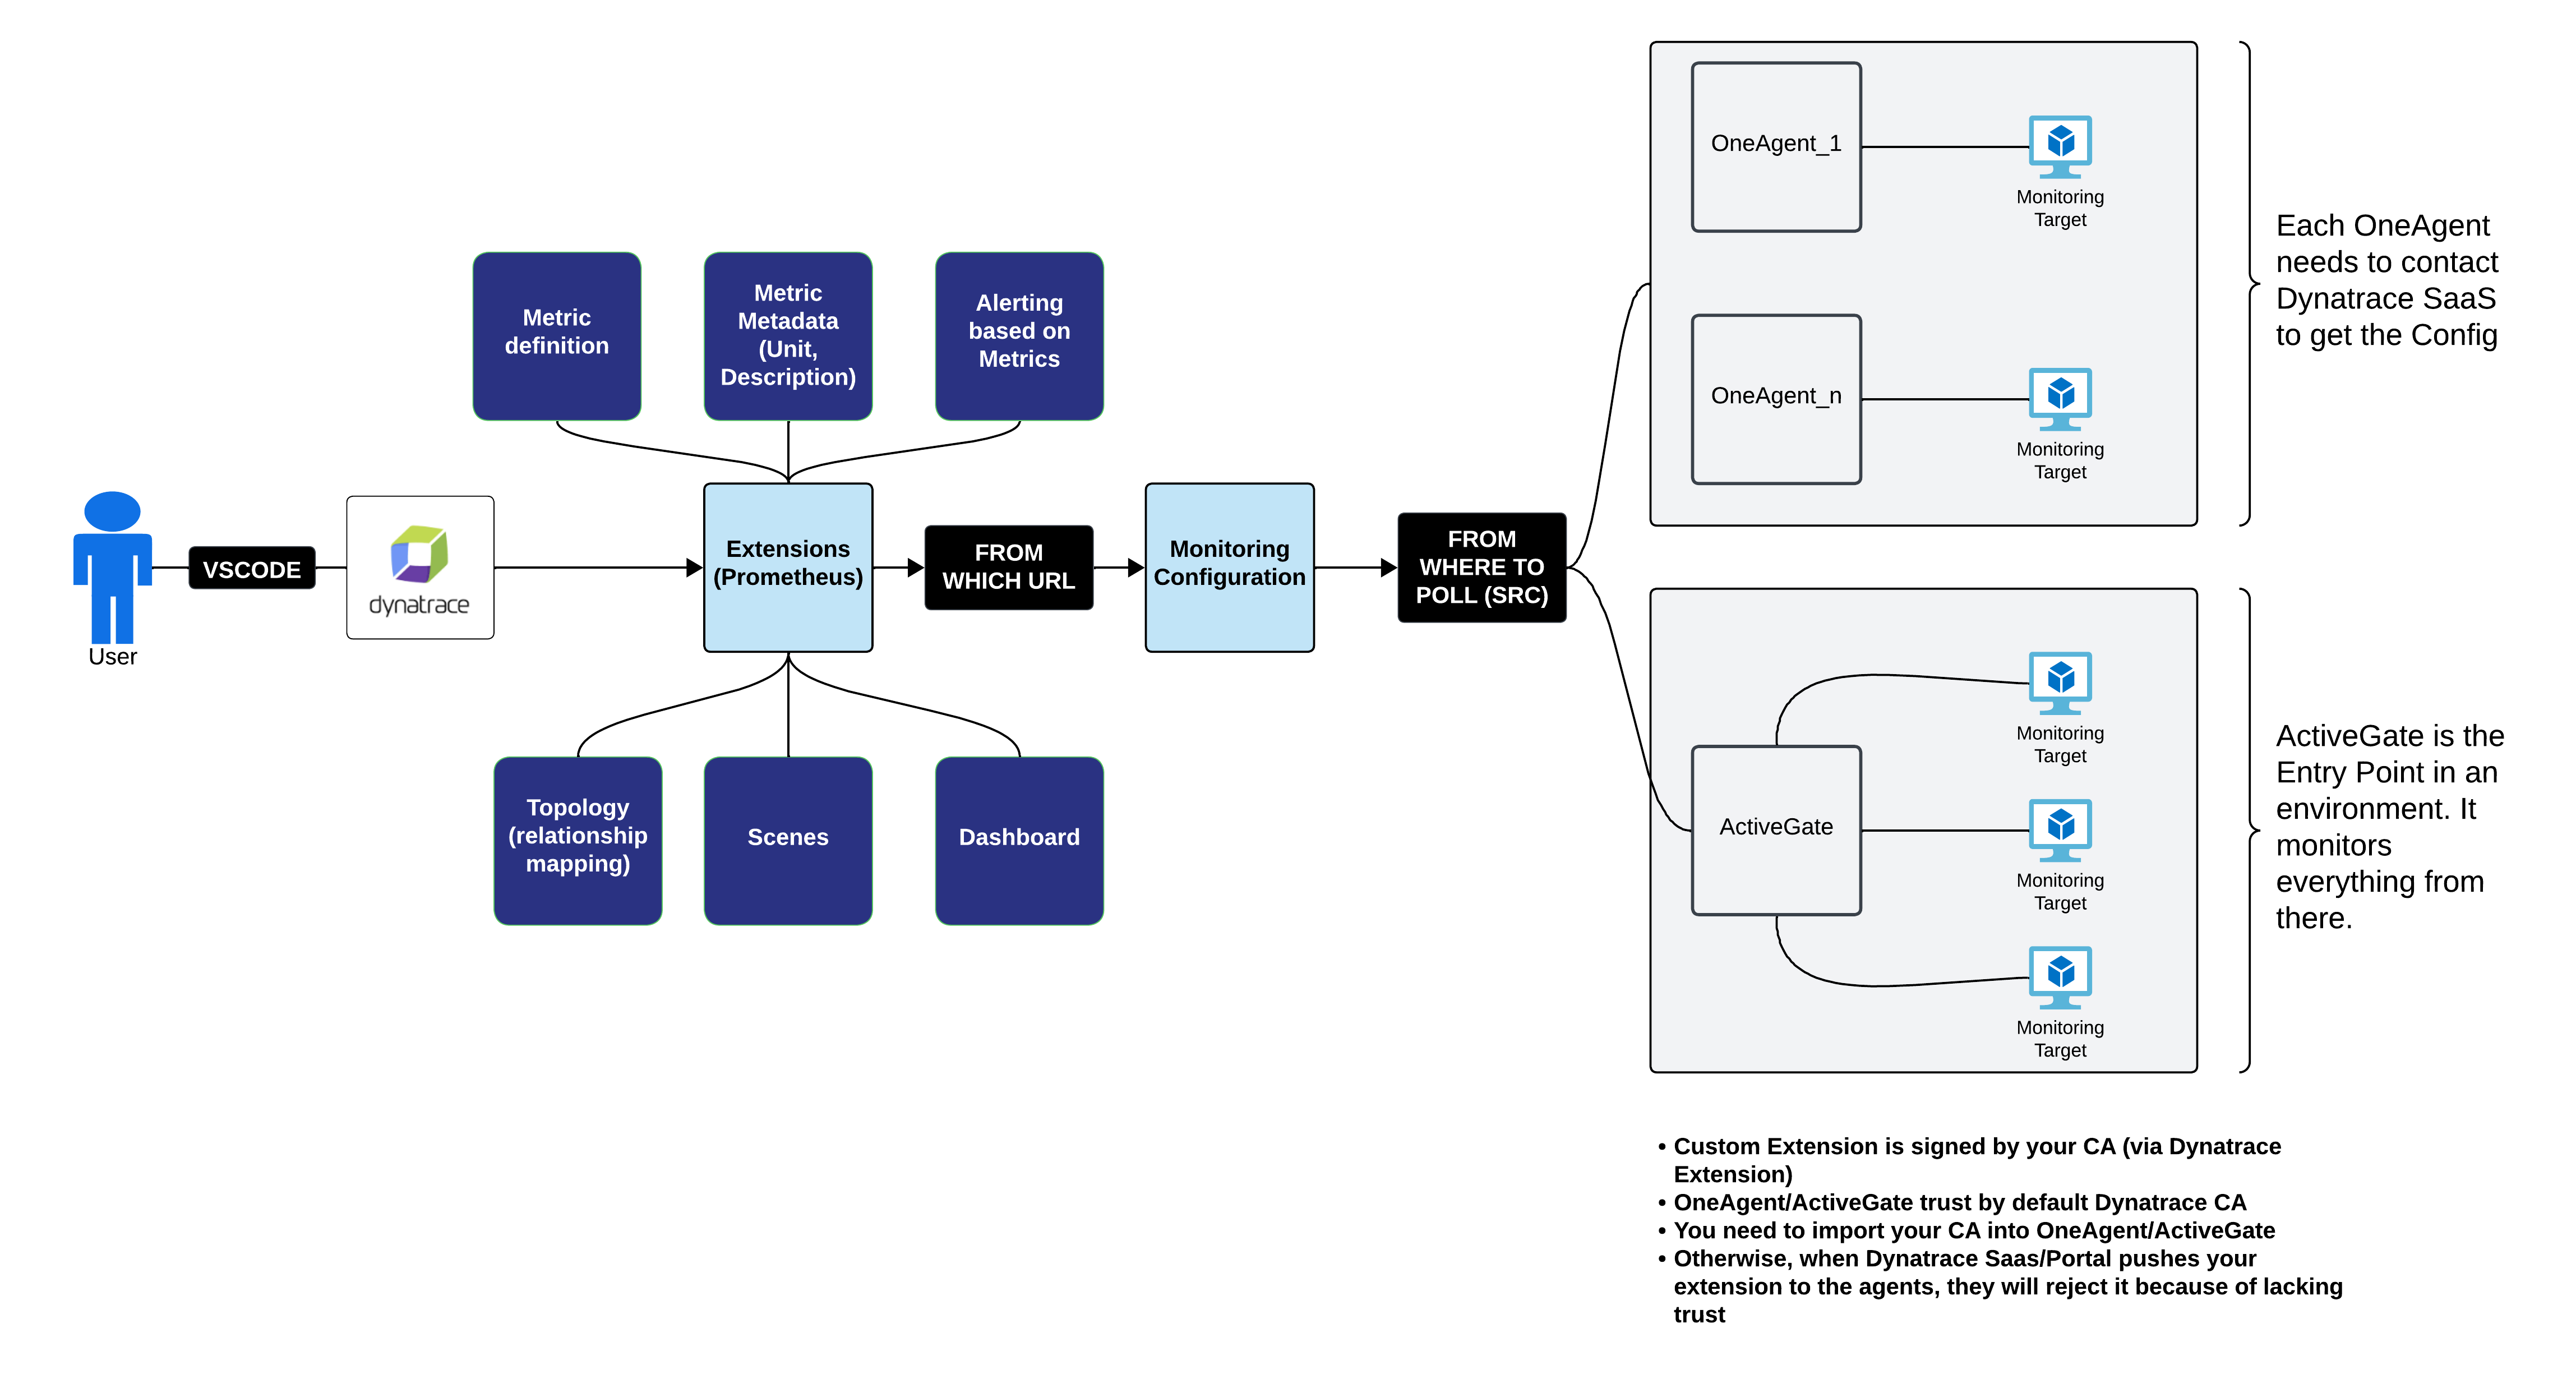
Dynatrace has the following elements:
- custom extension (Python, Prometheus metric config) By default the premade Prometheus extension that Dynatrace has is out of the box integrated with K8S. The extension defines among others metrics, topology (relations between elements/metrics it fetches, like Spoke depends on Transit), dashboards, alerts. The extension NEEDs to be RUN somewhere That somewhere = MONITORING CONFIGURATION
- Monitoring Configuration
- defines which URL to contact to fetch the Metrics defined before
- where to run it from (OneAgent, ActiveGate)
I’ve made a picture here of what my own understanding of all the components is. I’m more the visual type so I need a 360 degree overview to know in which direction to go and what to read for configuring something.
Setting it up
Activate Aviatrix Metrics API
Aviatrix provides a Prometheus/Openmetrics Endpoint which can be queried on the CoPilot Platform over HTTPs while using a Bearer Token for authentication.
The documentation displayed here is pretty explanatory and clear: https://docs.aviatrix.com/documentation/latest/monitoring-troubleshooting/metrics-api-enable.html?expand=true
You basically have to go in:
CoPilot -> Settings -> Configuration -> Network Insights API -> Enable
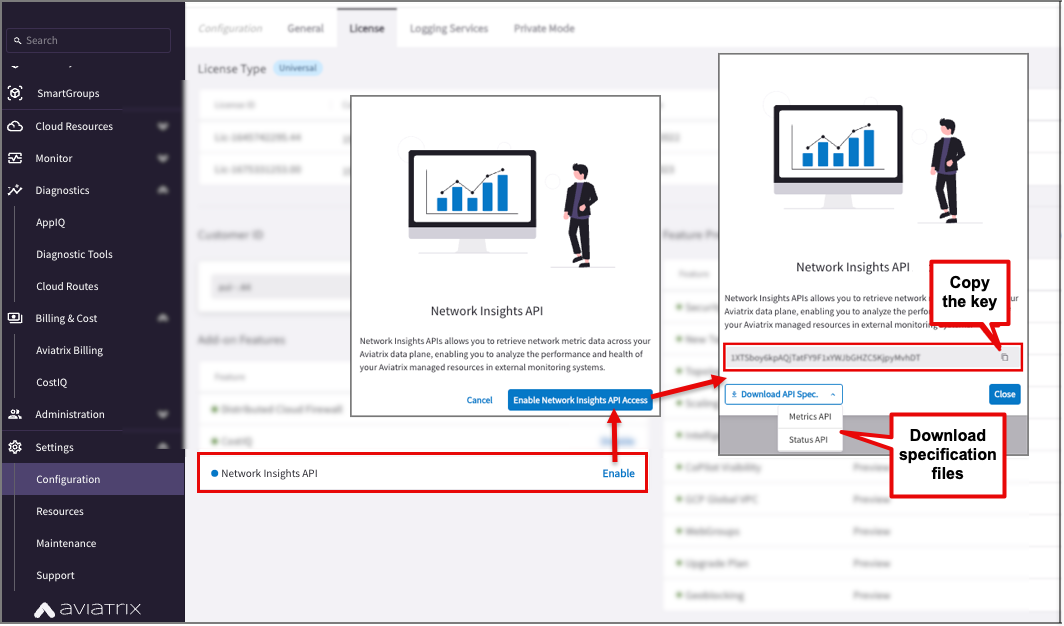
and you will get a Token (the “key” from the picture above).
If you want to try out and see what you get as output you can use Curl from any Linux/MacOS Terminal or via Postman.
curl -k -X ‘GET’ ‘https://
/metrics-api/v1/gateways’ -H 'Authorization: Bearer <TOKEN YOU GOT FROM COPILOT UI>>'
It will look like this:
memory_available{gateway="Controller"} 5297311744 1722869678000
memory_cached{gateway="Controller"} 2892021760 1722869678000
memory_buf{gateway="Controller"} 2364575744 1722869678000
memory_swpd{gateway="Controller"} 0 1722869678000
memory_free{gateway="Controller"} 363819008 1722869678000
cpu_idle{gateway="Controller"} 72 1722869678000
cpu_wait{gateway="Controller"} 0 1722869678000
cpu_us{gateway="Controller"} 4 1722869678000
cpu_ks{gateway="Controller"} 23 1722869678000
rx_drop{gateway="Controller", interface="eth0"} 0 1722869678000
tx_drop{gateway="Controller", interface="eth0"} 0 1722869678000
rate_rx_drop{gateway="Controller", interface="eth0"} 0 1722869678000
rate_tx_drop{gateway="Controller", interface="eth0"} 0 1722869678000
rate_pkt_drop{gateway="Controller", interface="eth0"} 0 1722869678000
bandwidth_ingress_limit_exceeded{gateway="Controller", interface="eth0"} 0 1722869678000
rate_sent{gateway="Controller", interface="eth0"} 181953.86666666667 1722869678000
rate_received{gateway="Controller", interface="eth0"} 162616.8 1722869678000
rate_total{gateway="Controller", interface="eth0"} 344570.6666666666 1722869678000
pps_limit_exceeded{gateway="Controller", interface="eth0"} 0 1722869678000
rx_drop{gateway="Controller", interface="docker0"} 0 1722869678000
tx_drop{gateway="Controller", interface="docker0"} 0 1722869678000
rate_rx_drop{gateway="Controller", interface="docker0"} 0 1722869678000
rate_tx_drop{gateway="Controller", interface="docker0"} 0 1722869678000
rate_pkt_drop{gateway="Controller", interface="docker0"} 0 1722869678000
bandwidth_ingress_limit_exceeded{gateway="Controller", interface="docker0"} 0 1722869678000
rate_sent{gateway="Controller", interface="docker0"} 0 1722869678000
rate_received{gateway="Controller", interface="docker0"} 0 1722869678000
rate_total{gateway="Controller", interface="docker0"} 0 1722869678000
pps_limit_exceeded{gateway="Controller", interface="docker0"} 0 1722869678000
rx_drop{gateway="Controller", interface="lo"} 0 1722869678000
tx_drop{gateway="Controller", interface="lo"} 0 1722869678000
rate_rx_drop{gateway="Controller", interface="lo"} 0 1722869678000
rate_tx_drop{gateway="Controller", interface="lo"} 0 1722869678000
rate_pkt_drop{gateway="Controller", interface="lo"} 0 1722869678000
bandwidth_ingress_limit_exceeded{gateway="Controller", interface="lo"} 0 1722869678000
rate_sent{gateway="Controller", interface="lo"} 471936.5333333333 1722869678000
rate_received{gateway="Controller", interface="lo"} 471936.5333333333 1722869678000
rate_total{gateway="Controller", interface="lo"} 943873.0666666667 1722869678000
pps_limit_exceeded{gateway="Controller", interface="lo"} 0 1722869678000
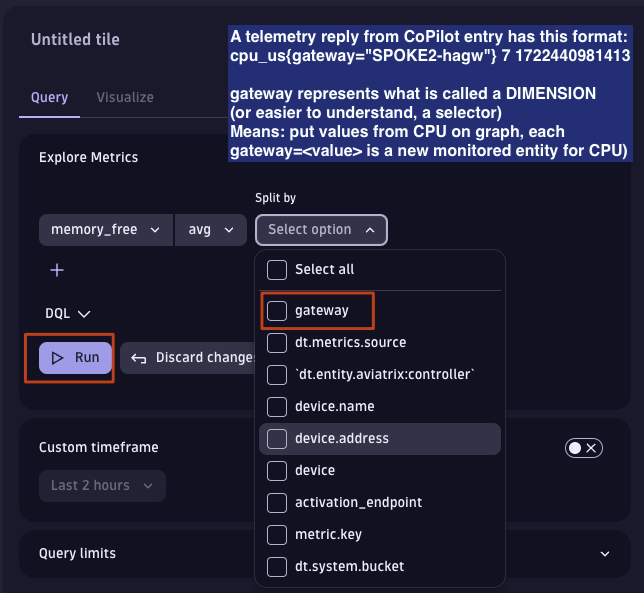
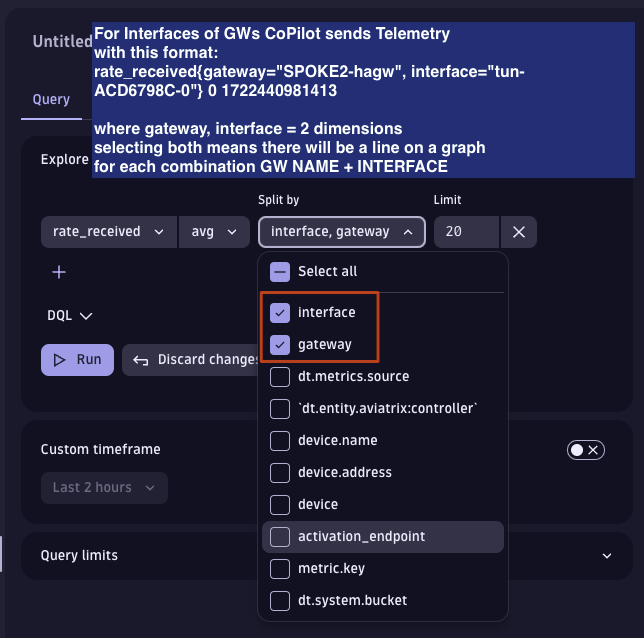
Similar entries you will see for gateway = {each of your gateway names}, respectively for each gw+interface combination {gateway=“spoke-123”, interface = “tun-XXX”}.
Keep the name of these metrics in mind as possible values to fetch data for from CoPilot split into categories based on “dimensions” where dimension means:
- gateway = “Name of entity the values are returned for”
- interface = “Together with Gateway, for which interface on it the stats are represented”
Install ActiveGate somewhere on a machine allowed to poll CoPilot IP (NSGS/SGs have to permit this)
Remember that ActiveGate or Oneagent machines will be the one(s) polling the CoPilot APIs. It’s where your extension gets deployed and monitoring configuration activated.
Dynatrace Saas is similar to a Control Plane which configures agents and gets stats from them. Then it processes them, builds dashboards, alerts, business logic, etc. Oneagent/ActiveGate is where your extensions run to gather data from the things you want to monitor.
If you’re curious like me, then my first question was can I not use Oneagent instead of ActiveGate? What is the difference?
As long as I can deploy my Prometheus custom extension on either and specify a non-localhost destination then is there any notable difference? The answer relates to more than functionality but also to metrics/license. Searching the dynatrace forum revealed this explanation (albeit for a custom use case iwth IBM MQ):
Extensions run within OneAgent and fully integrate the new technology monitoring into Dynatrace smartscape and problem detection.
ActiveGate Extensions (aka Remote Extensions) are executed on ActiveGate and can acquire metrics and topology from remote sources.
One of the main advantages is that it will start consuming host DDUs first. Metrics should be the same in both cases.
If you’ve got an OS that supports OA (OneAgent) extensions (Windows or Linux) and you’re allowed by the IBM MQ team to install the extension directly on the box I’d go with that one if I were you.
Maintaining the extension on an ActiveGate might be easier than on the IBM MQ server, but that’s more an organizational topic.
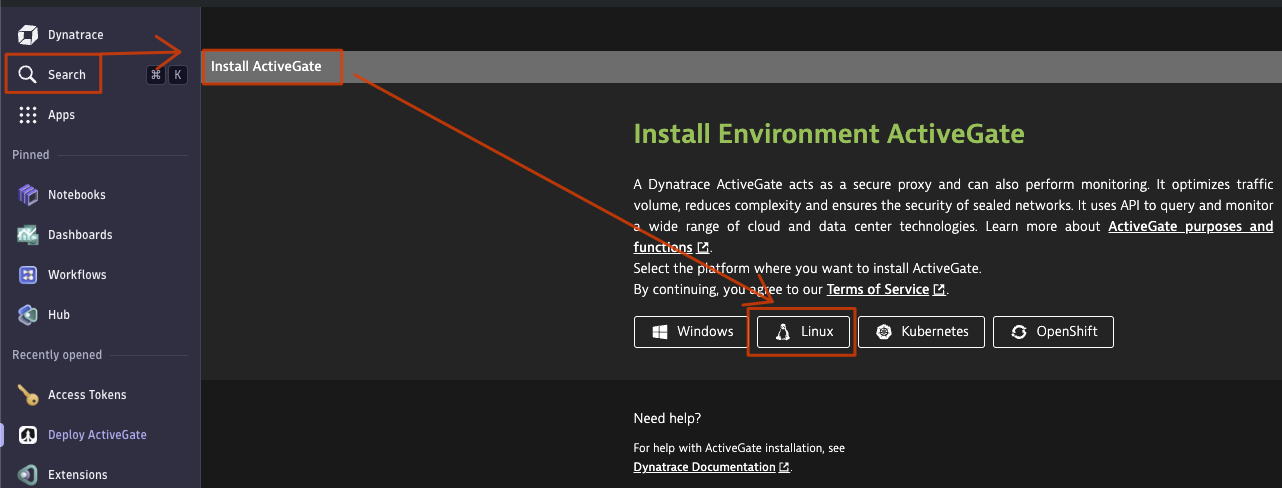
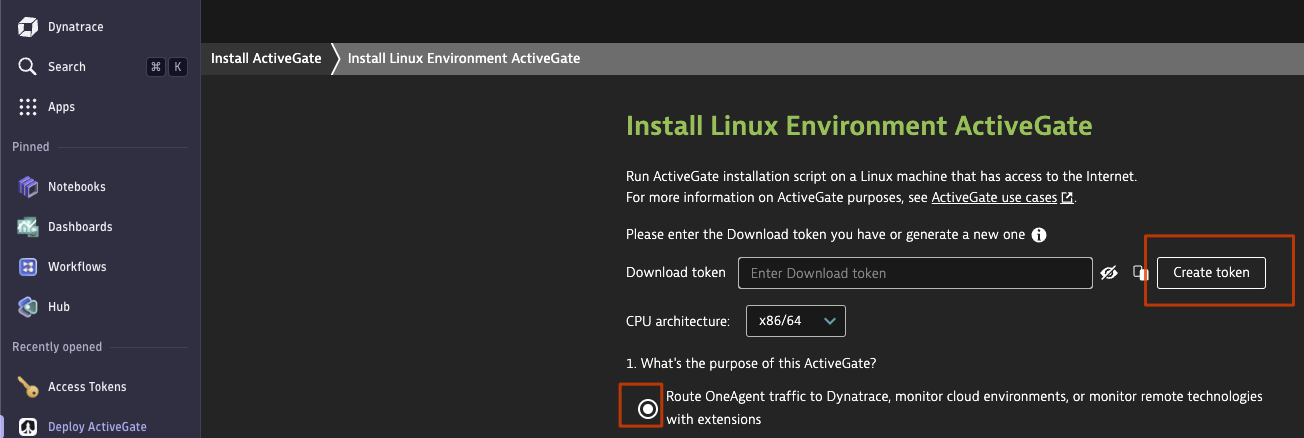
Run the package installer for ActiveGate on your Linux box that has access to poll CoPilot Metric API:
root@my-system# sh Dynatrace-ActiveGate-Linux-x86-1.295.27.sh
root@my-system# systemctl status dynatracegateway.service
root@my-system# systemctl status dynatraceautoupdater.service
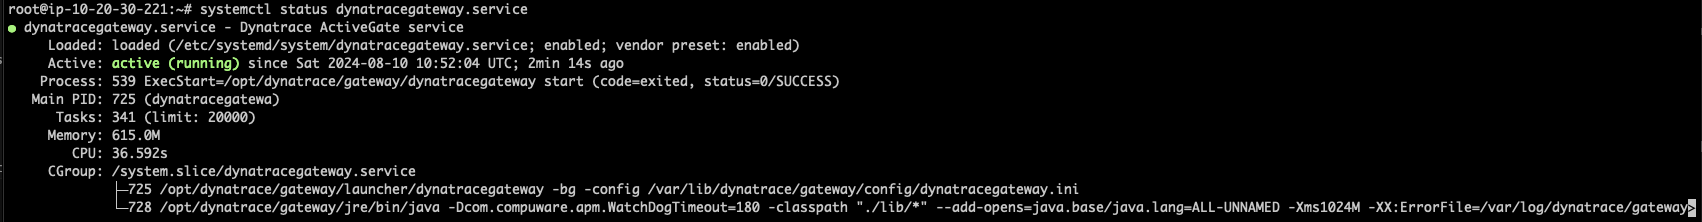
Install Dynatrace Plugin in VSCode
Install Mac CA VSCode
Wondering what this is, right ?
In case you use the VSCode Dynatrace Plugin for auto-populating metric definitions in your custom Dynatrace extension code (kind of it as a cool discovery mode), then the extension needs to contact CoPilot from your Laptop to fetch the metrics.
When you do that, then if using some custom, internal company-CA on CoPilot, then VSCode won’t trust the certificate it gets from https://<copilot-ip/metrics-api/v1/gateways>.
By default VSCode extensions won’t look in your OS Certificate Trust Chain to see if that company-CA is in there.
This plugin changes this behavior and forces VSCode plugins to look there.
There is also an alternative where you can just use a file that contains a dump of the metrics to prepopulate/auto-discover metric definitions in the VSCode Dynatrace Extensions.
I admit to having used that as it was less time consuming.
I tried this extension, I solved the certificate trust problem (you cannot chose an option to ignore self-signed certs) but then VSCode complained the CoPilot Cert is self signed at the top level and not by a CA.
If you have Windows, then you need win-ca
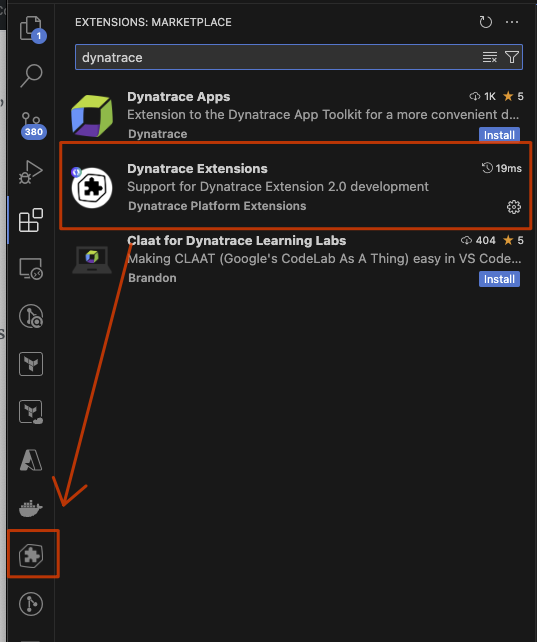
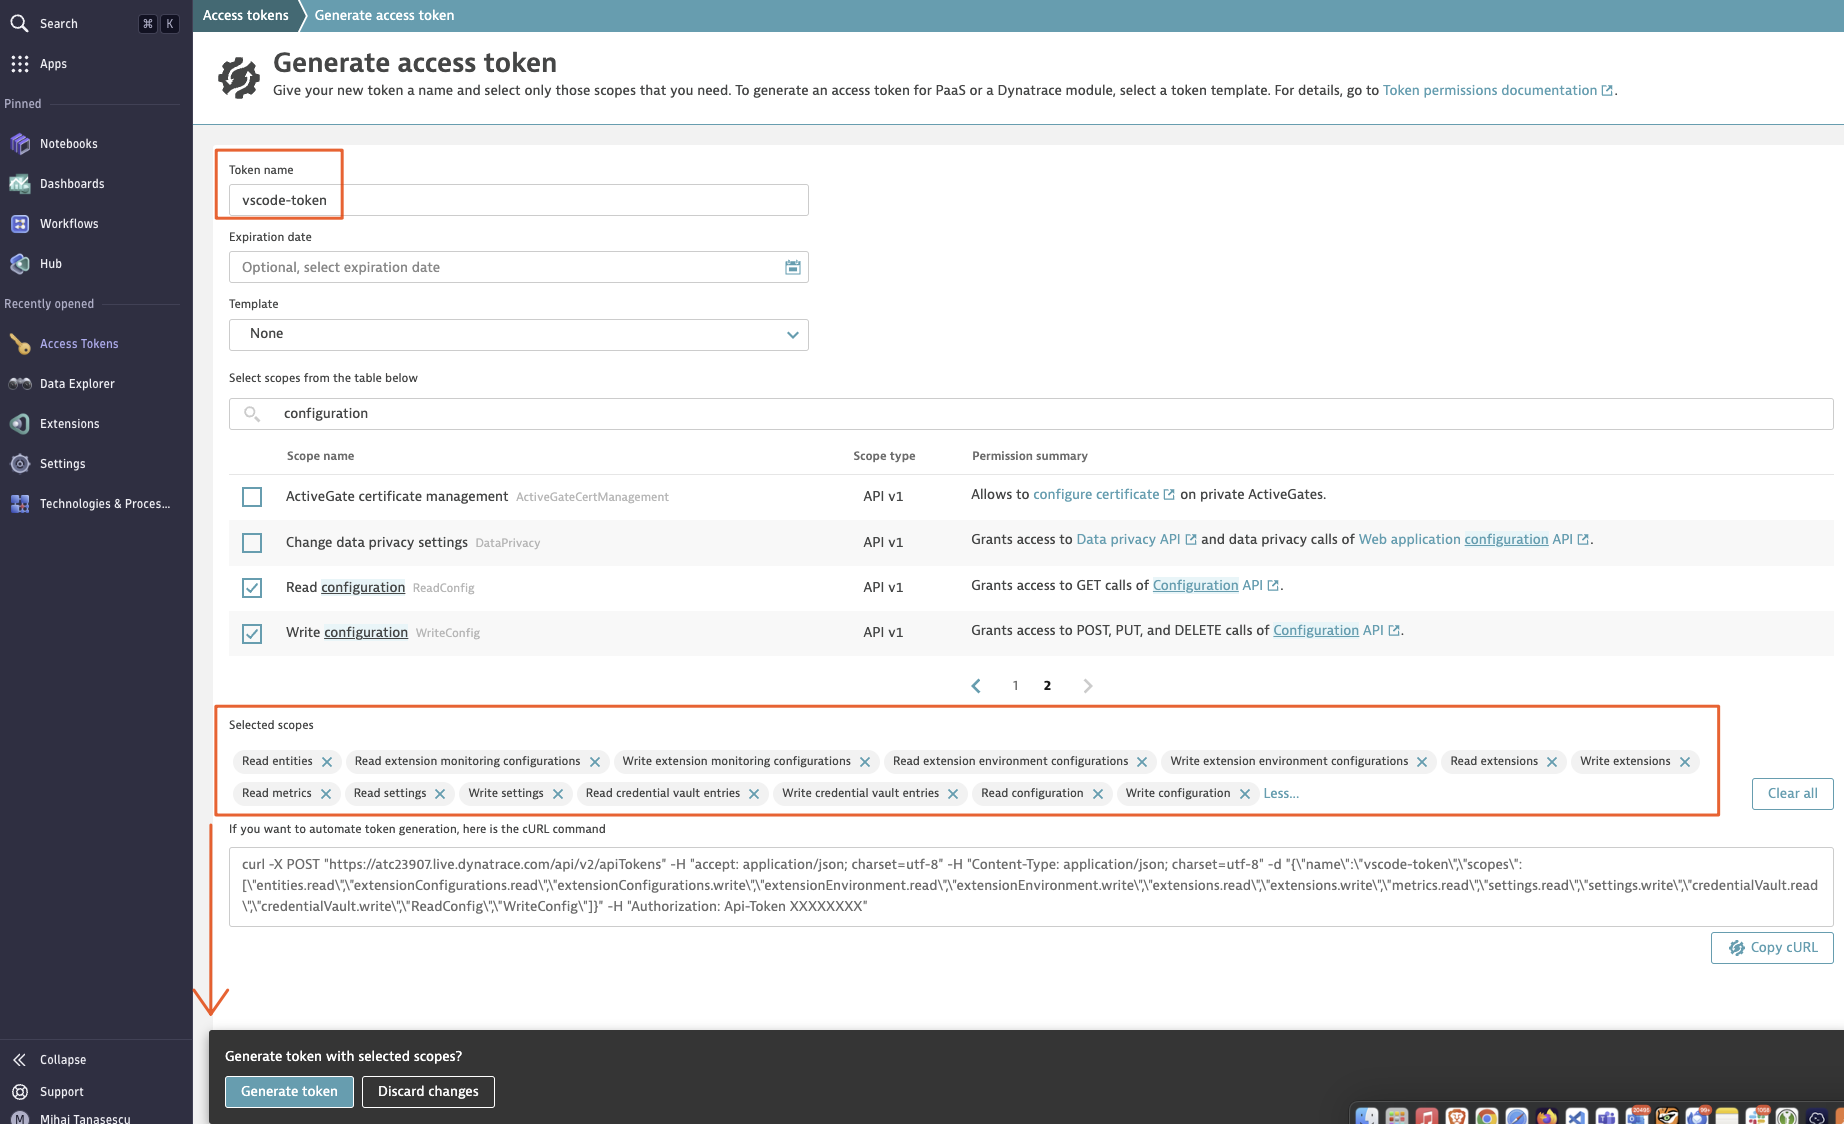
Generate Access Token
VSCode needs to contact Dynatrace SaaS to publish the extension that you create and make it available to be used for collecting metric data.
For this communication to be allowed you need an API Token and the proper rights in Dynatrace assigned to it.
Go to your Dynatrace SaaS URL and generate a Token:
Add rights to it:
You will later configure this Token in VScode in the Dynatrace Plugin Settings.
Create Environment, Workspace, Initialize Workspace
Environment
Go to VSCode, click on the Sign above the Magnifying Glass which represents Dynatrace.
Add Environment -> put here your Dynatrace URL & then the access token that you previously generated
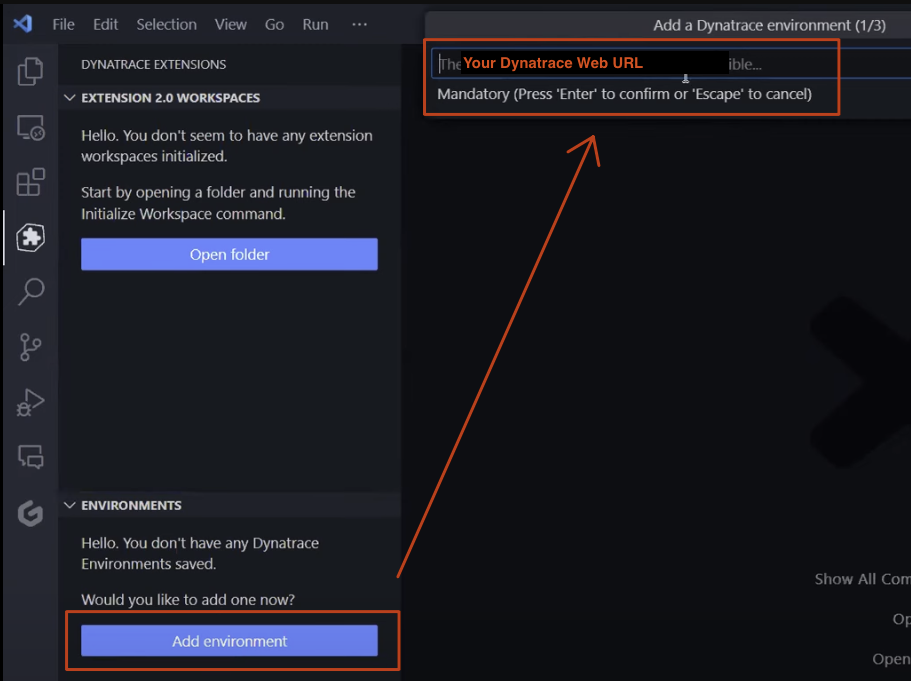
Choose to set it as your default environment, give it a name (in my case it is Aviatrix)
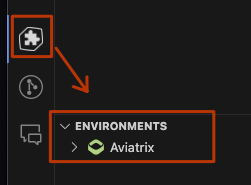
Don’t worry if clicking on it shows nothing.
Later on when we finish our Monitoring Configuration (what URL to poll for metrics and using which Agents = Oneagent/ActiveGate to send the request) it will start showing it there.
Workspace
Now it’s time to Add a Folder which will be your workspace for the custom metrics Prometheus extension that get values from Aviatrix CoPilot.
Queries will be sourced in my case from a machine running Dynatrace ActiveGate and contacting CoPilot Metrics API (I was too lazy and I installed ActiveGate on CoPilot itself).
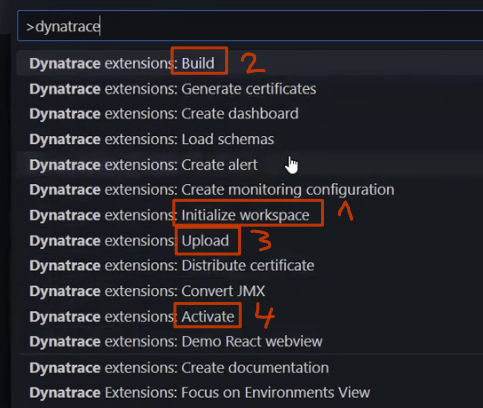
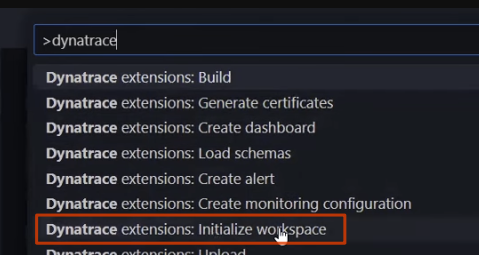
If you want to see what other options of the Dynatrace plugin exist, then press FN+F1 on a Mac Keyboard to get this dropdown:
Initialize Workspace
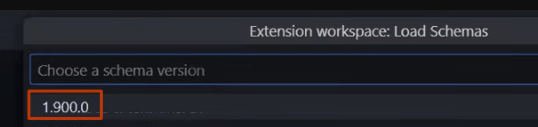
You select a schema version.
This encompasses things like what you can define in your extension, formatting of metric definitions, structure of the elements you put in your extension, what fields are mandatory, what not, how they are validated before pushing to Dynatrace SaaS).
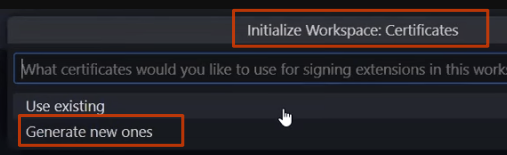
Then you need your Certificates setup. Remember that you (the VSCode Dynatrace plugin in fact) will be signing your Extension.

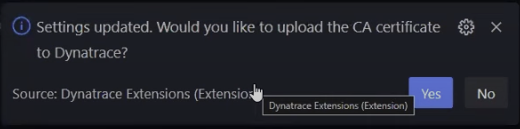

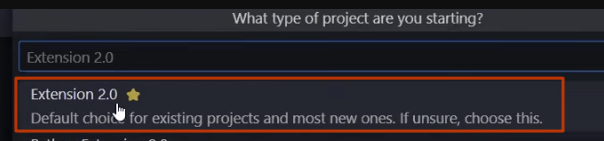
Select No, there’s only a 1% chance that you decide to install OneAgent/ActiveGate on your development workstation.

We choose Extension 2.0 (we have no Python custom extension or JMX = java monitoring)
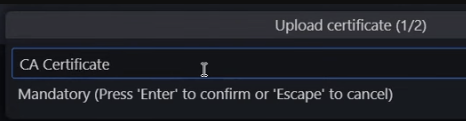
Import VSCode Dynatrace extension CA Certificate on Active Gate
The VScode plugin only copies your CA to locally running (on the same machine) OneAgent/ActiveGate instances.
This is rarely the case in production => you must copy the cert to your ActiveGate instance.
Take the path from VSCode -> Plugin Settings for Dynatrace for the CA:
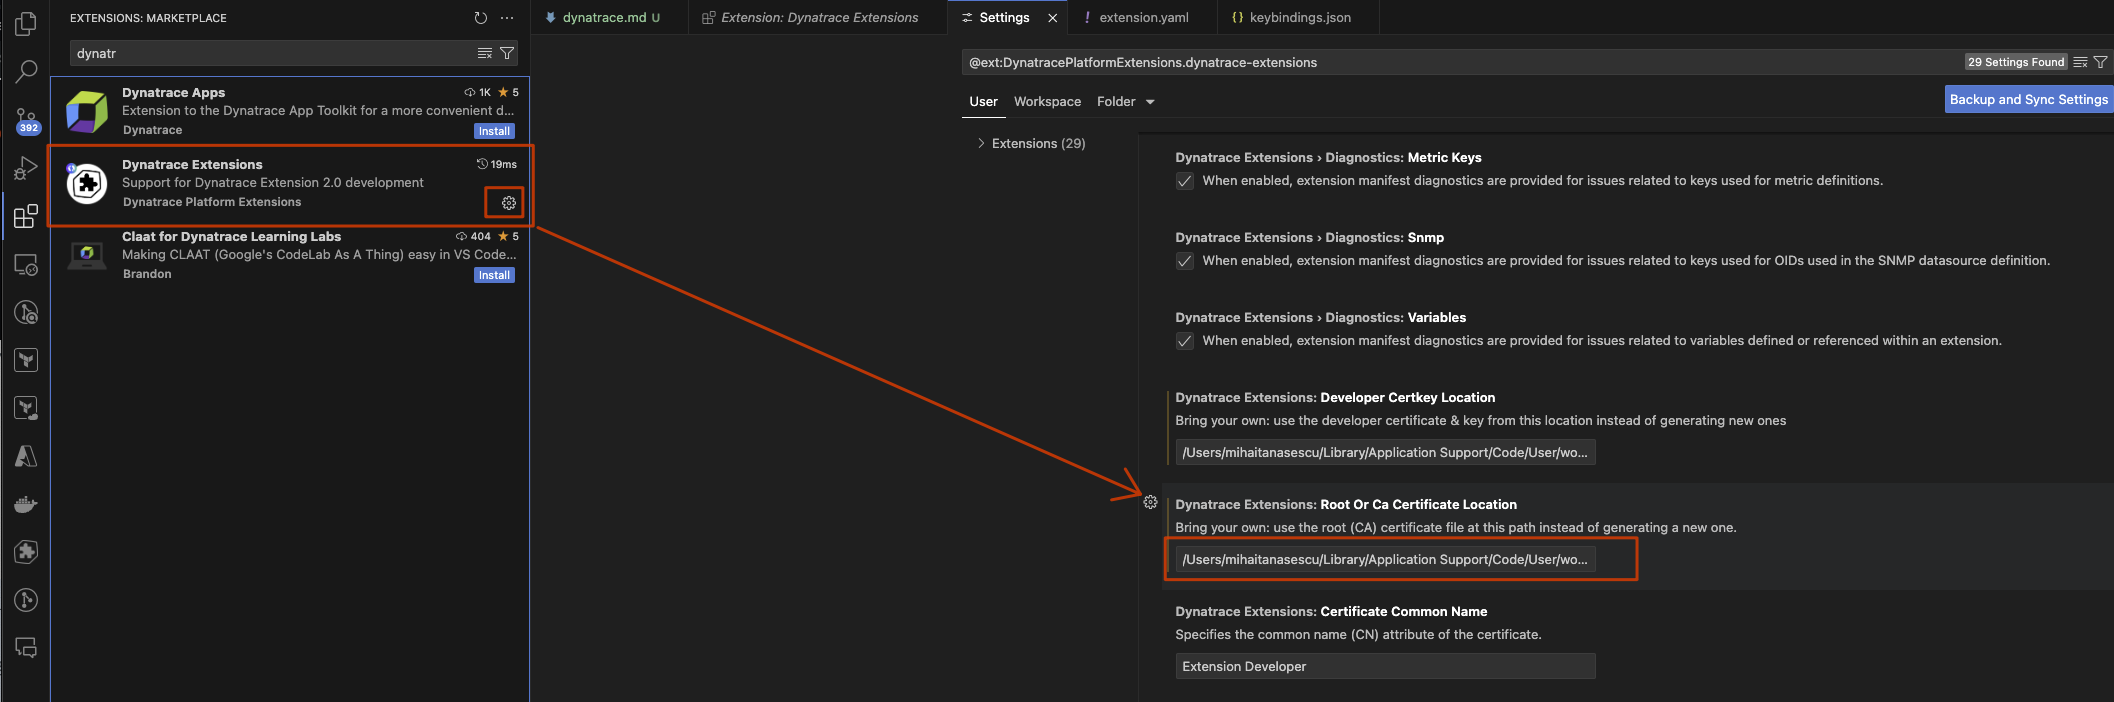
Get the CA contents and paste them then on the ActiveGate machine in the proper place:
cat <path from screenshot above>
ssh <machine with ActiveGate>
sudo vim /var/lib/dynatrace/remotepluginmodule/agent/conf/certificates/ca.pem
# paste the contents from the "cat" command above and save the file
Restart ActiveGate service:
systemctl restart dynatracegateway
Create Extension
Define your extension metadata:
name: custom:aviatrix
version: 2.0.56
minDynatraceVersion: "1.900"
author:
  name: Mihai
Add prometheus section:
Creating the extension to poll CoPilot API gives you a cool option: Scrape Data
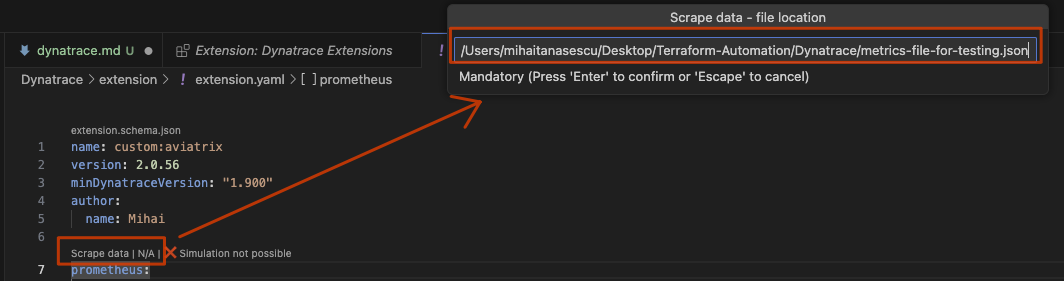
What does this do?
It either polls your CoPilot URL and of course also asks for the API key we got at 1st step when configuring the Metrics Api in CoPilot
OR
if feeling lazy/running into errors with self-signed certificates, then you can dump the reply from CoPilot Metrics API into a file (query via Curl) and use that
file for reading metric definitions
It then can use the metric names (it does not need the values at this point) it just fetched to generate the Metric Definitions inside the Dynatrace extension in VSCode automagically.
This means it saves you time to go through documentation of Dynatrace, syntax, formatting, no more headaches, really cool stuff.
These definitions, once you uploaded your extension to Dynatrace Saas, will tell Dynatrace what it expects to read from CoPilot and import into its own system/DB.
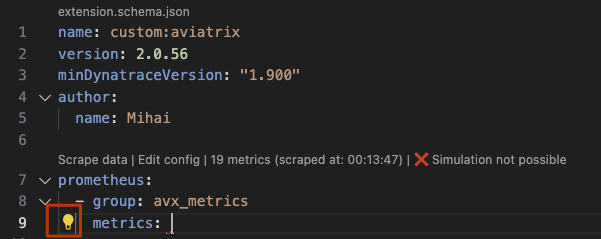
To see that in action type “metrics: “ statement and you will see a lightbulb appearing, select Insert all scraped metrics
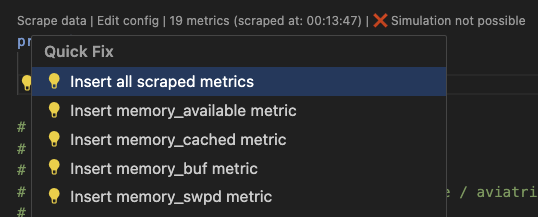
The result should look like this (almost):
prometheus:
  - group: avx_metrics
    metrics:
      - key: memory_available
        value: metric:memory_available
        type: gauge
        featureSet: memory
      - key: memory_cached
        value: metric:memory_cached
        type: gauge
        featureSet: memory
      - key: memory_buf
        value: metric:memory_buf
        type: gauge
        featureSet: memory
      - key: memory_swpd
        value: metric:memory_swpd
        type: gauge
        featureSet: memory
      - key: memory_free
        value: metric:memory_free
        type: gauge
        featureSet: memory
      - key: cpu_idle
        value: metric:cpu_idle
        type: gauge
        featureSet: cpu
      - key: cpu_wait
        value: metric:cpu_wait
        type: gauge
        featureSet: cpu
      - key: cpu_us
        value: metric:cpu_us
        type: gauge
        featureSet: cpu
      - key: cpu_ks
        value: metric:cpu_ks
        type: gauge
        featureSet: cpu
      - key: rx_drop
        value: metric:rx_drop
        type: gauge
        featureSet: interfaces
      - key: tx_drop
        value: metric:tx_drop
        type: gauge
        featureSet: interfaces
      - key: rate_rx_drop
        value: metric:rate_rx_drop
        type: gauge
        featureSet: interfaces
      - key: rate_tx_drop
        value: metric:rate_tx_drop
        type: gauge
        featureSet: interfaces
      - key: rate_pkt_drop
        value: metric:rate_pkt_drop
        type: gauge
        featureSet: interfaces
      - key: bandwidth_ingress_limit_exceeded
        value: metric:bandwidth_ingress_limit_exceeded
        type: gauge
        featureSet: interfaces
      - key: rate_sent
        value: metric:rate_sent
        type: gauge
        featureSet: interfaces
      - key: rate_received
        value: metric:rate_received
        type: gauge
        featureSet: interfaces
      - key: rate_total
        value: metric:rate_total
        type: gauge
        featureSet: interfaces
      - key: pps_limit_exceeded
        value: metric:pps_limit_exceeded
        type: gauge
        featureSet: interfaces
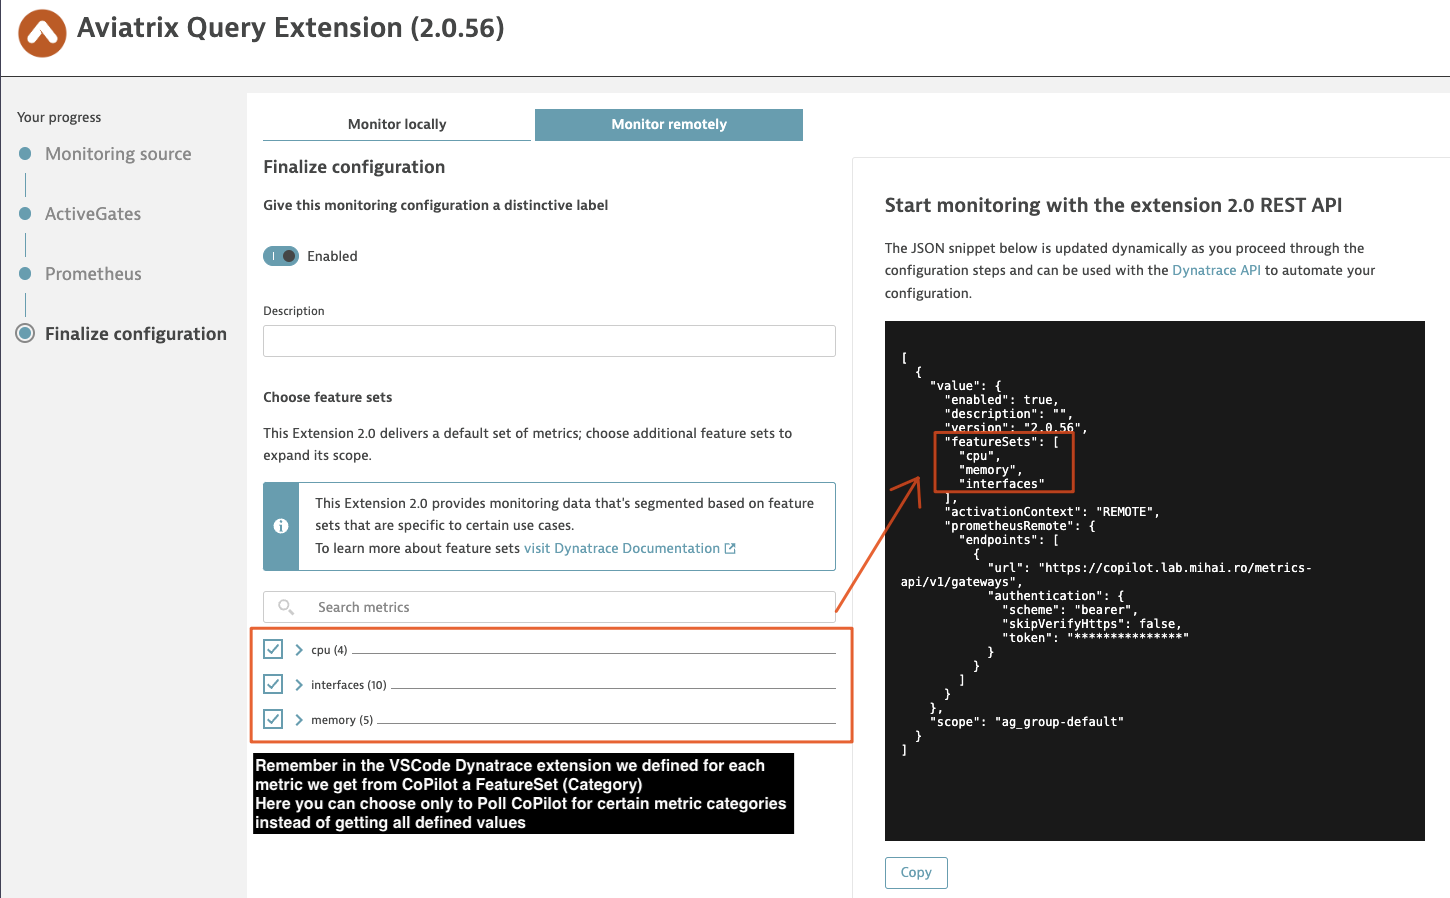
I said almost because I cheated and added “featureSet”.
FeatureSet allows me to define some groups of metrics for which I can enable/disable polling (for example I can say later in my Monitoring Configuration: “when using ActiveGate XYZ to Poll CoPilot URL A.B.C.D, then only do it for category memory of metrics”)
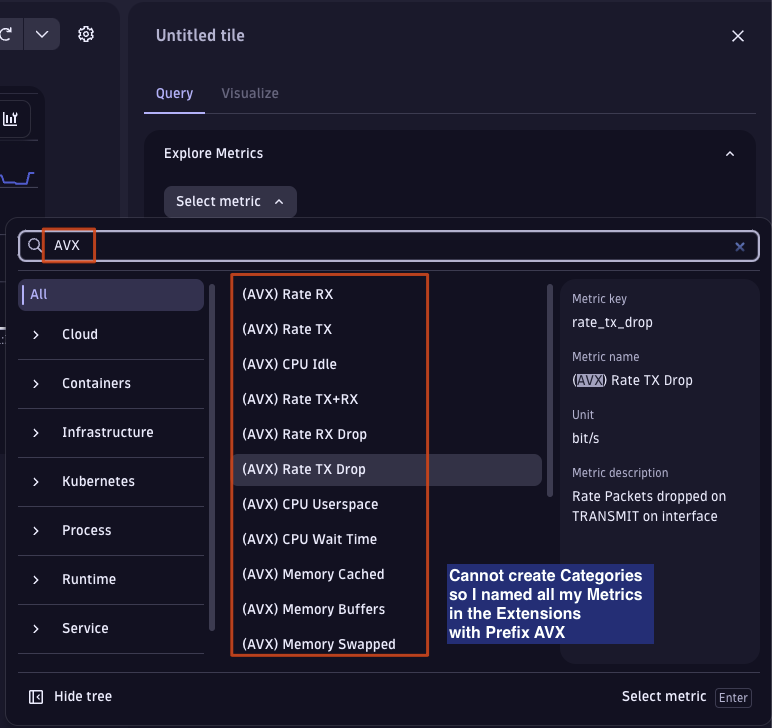
Metric Metadata
This part means metrics names, descriptions, unit of measurement for each.
I added the following in my lab:
metrics:
  - key: memory_available
    metadata:
      displayName: (AVX) Memory Available
      description: Available Memory to be allocated to CPUs (includes cache)
      unit: Byte
  - key: memory_cached
    metadata:
      displayName: (AVX) Memory Cached
      description: Cached memory (can be reallocated if needed)
      unit: Byte
  - key: memory_buf
    metadata:
      displayName: (AVX) Memory Buffers
      description: Memory used for kernel buffers
      unit: Byte
  - key: memory_swpd
    metadata:
      displayName: (AVX) Memory Swapped
      description: Memory Swap
      unit: Byte
  - key: memory_free
    metadata:
      displayName: (AVX) Memory Free (available + cache)
      description: Free memory (not yet allocated, does NOT include cache)
      unit: Byte
  - key: cpu_idle
    metadata:
      displayName: (AVX) CPU Idle
      description: CPU Idle time, doing really nothing
      unit: Percent
  - key: cpu_us
    metadata:
      displayName: (AVX) CPU Userspace
      description: CPU used by userspace programs
      unit: Percent
  - key: cpu_wait
    metadata:
      displayName: (AVX) CPU Wait Time
      description: CPU waits on I/O access
      unit: Percent
  - key: cpu_ks
    metadata:
      displayName: (AVX) CPU KernelSpace
      description: CPU used by linux kernel
      unit: Percent
  - key: rx_drop
    metadata:
      displayName: (AVX) Packets dropped on RX
      description: Packets dropped on RECEIVE on interface
      unit: BitPerSecond
  - key: tx_drop
    metadata:
      displayName: (AVX) Packets dropped on TX
      description: Packets dropped on TRANSMIT on interface
      unit: BitPerSecond
  - key: rate_rx_drop
    metadata:
      displayName: (AVX) Rate RX Drop
      description: Rate Packets dropped on RECEIVE on interface
      unit: BitPerSecond
  - key: rate_tx_drop
    metadata:
      displayName: (AVX) Rate TX Drop
      description: Rate Packets dropped on TRANSMIT on interface
      unit: BitPerSecond
  - key: rate_pkt_drop
    metadata:
      displayName: (AVX) Rate Packets Dropped (overall)
      description: Rate dropped packets
      unit: PerSecond
  - key: bandwidth_ingress_limit_exceeded
    metadata:
      displayName: (AVX) BW Ingress Limit Exceeded
      description: Exceeded BW Allowance in AWS
      unit: PerSecond
  - key: rate_sent
    metadata:
      displayName: (AVX) Rate TX
      description: Rate Bytes Sent
      unit: BitPerSecond
  - key: rate_received
    metadata:
      displayName: (AVX) Rate RX
      description: Rate Bytes Received
      unit: BitPerSecond
  - key: rate_total
    metadata:
      displayName: (AVX) Rate TX+RX
      description: Rate Bytes Sent/Received
      unit: BitPerSecond
  - key: pps_limit_exceeded
    metadata:
      displayName: (AVX) PPS Limit Exceeded
      description: PPS allowance in AWS exceeded for instance
      unit: Count
In practice this means that let’s say pps_limit_exceeded will show up in Dynatrace under Metrics like:
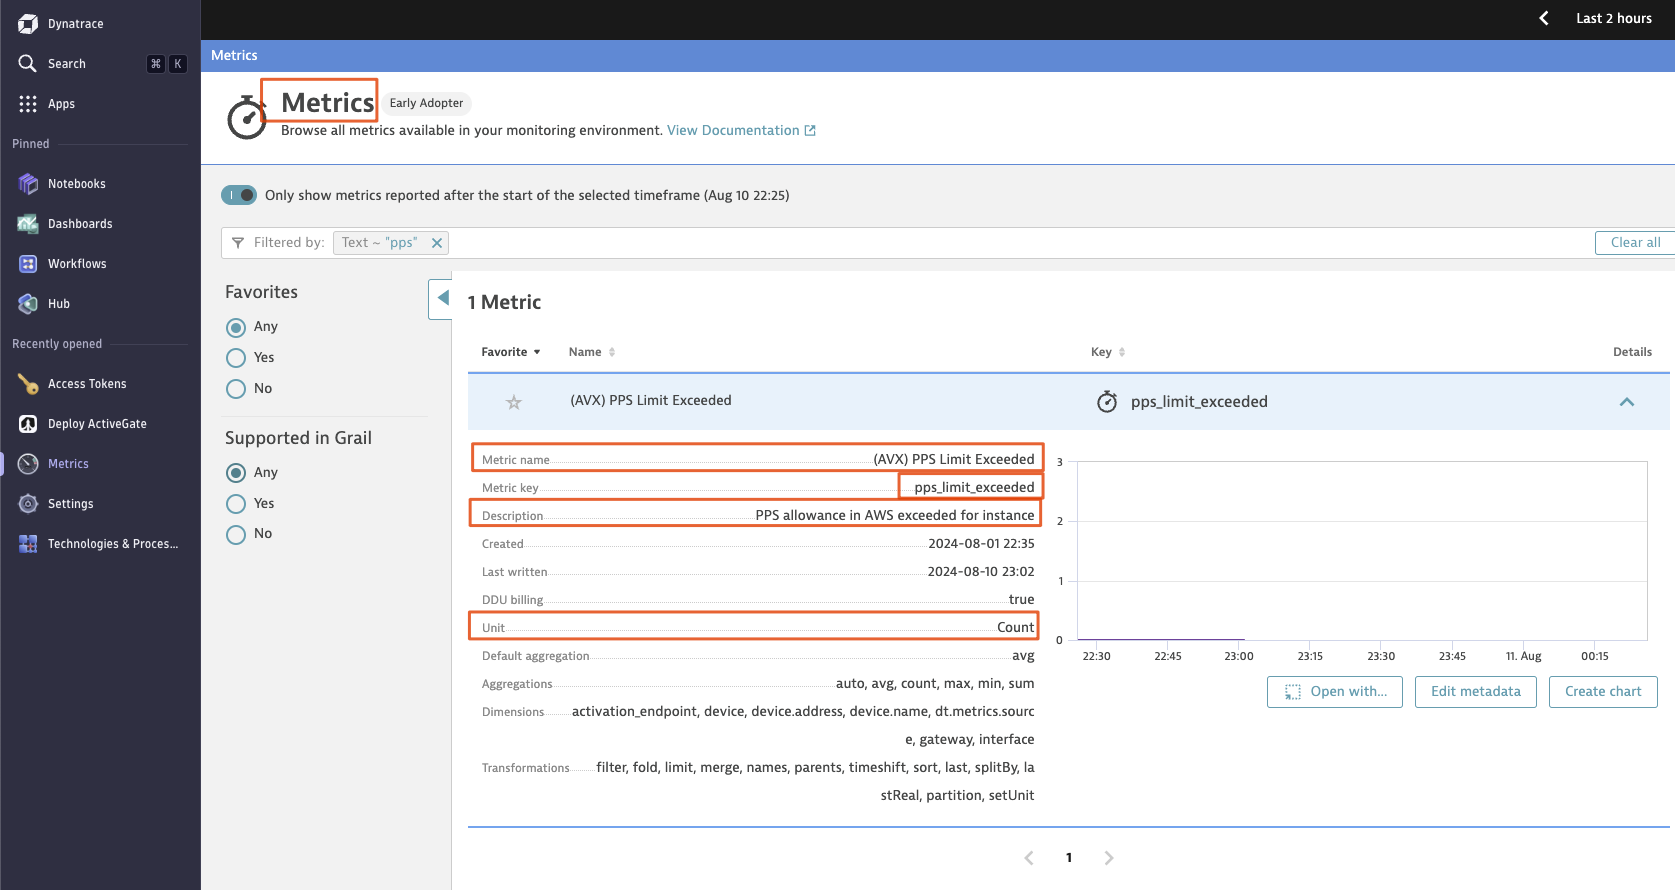
key is the binding element between metadata definition and metric correlation (Dynatrace name to Metric Name returned from polling CoPilot API):
key: pps_limit_exceeded  ==> name ending up in Dynatrace for it
value: metric:pps_limit_exceeded ==> from CoPilot Polling take pps_limit_exceeded
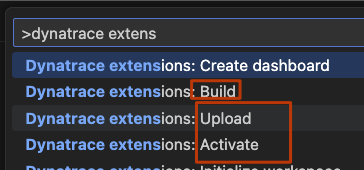
Uploading your extension to Dynatrace
Normally you would need to follow these steps:
- Build it (results in an archive)
- Upload it to Dynatrace
- Activate it (Dynatrace uses versioning and you can switch between different releases of your custom extension)
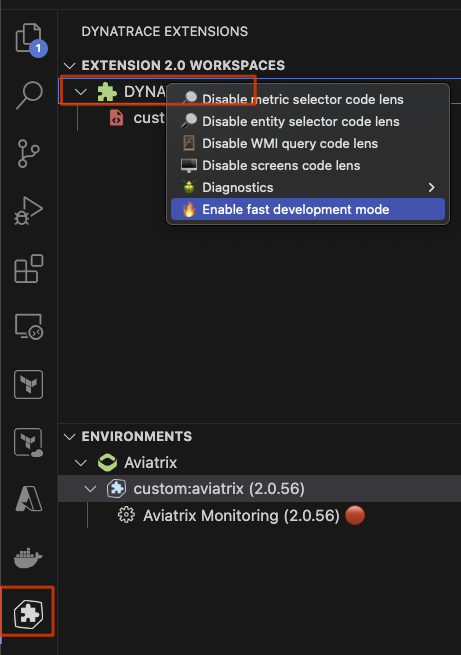
If you don’t like going through 3 different options there’s a much easier way that does it all upon Cmd+S / Save. Right click here and enable Fast Development Mode
Monitoring Configuration
We created our extension, we defined the metrics we fetch, their names, description but so far no configuration exists for polling CoPilot API:
- From which ActiveGate
- Which featureSets to poll for
- Which IP + API key to use (CoPilot API + Bearer Authorization Token we got when enabling the Metrics API there)
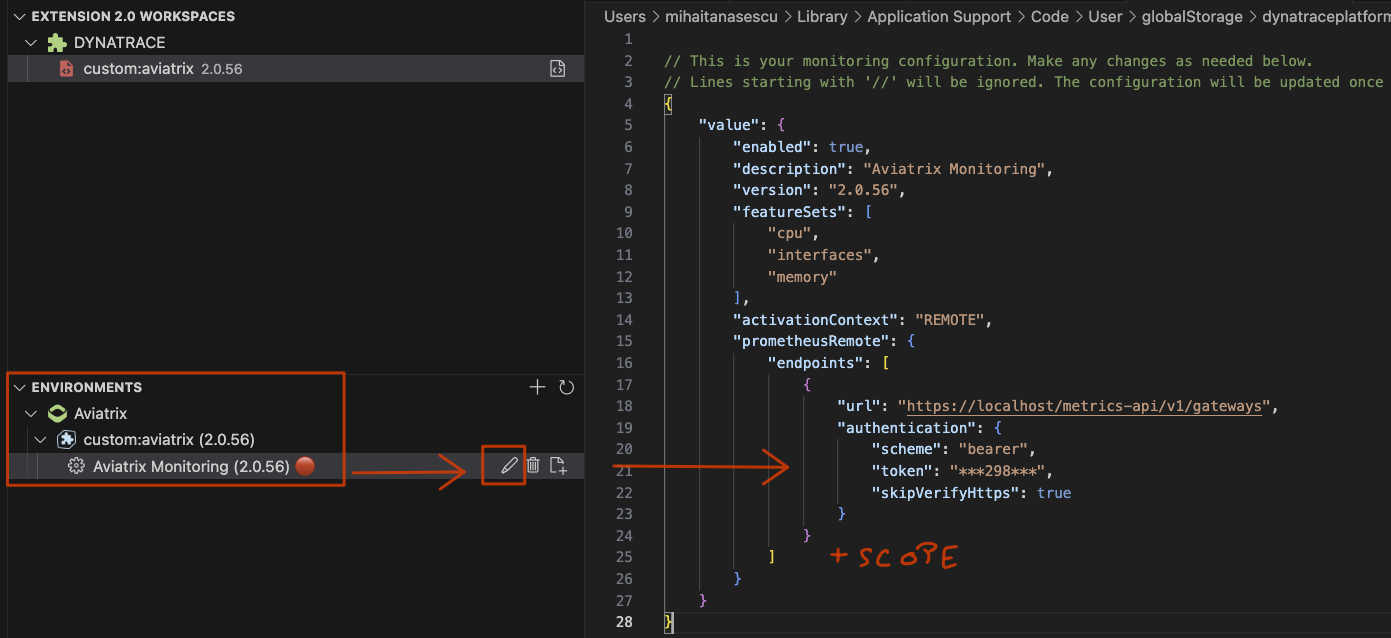
You can do this part also in VSCode, the problem is the 1st time you cannot.
In VSCode for defining a Monitoring Configuration you require a field “scope” which identifies uniquely your ActiveGate.
This field you only see what value it has once you do the configuration manually in the Dynatrace Portal and select your ActiveGate :)
This is where you do it in VSCode (but 1st time as stated you need manual config in Dynatrace Portal):
In Dynatrace GUI on the left side, go to the search bar and look for Extensions. If you have only custom extension, it will just land on your Aviatrix Extension, if not, then select it.
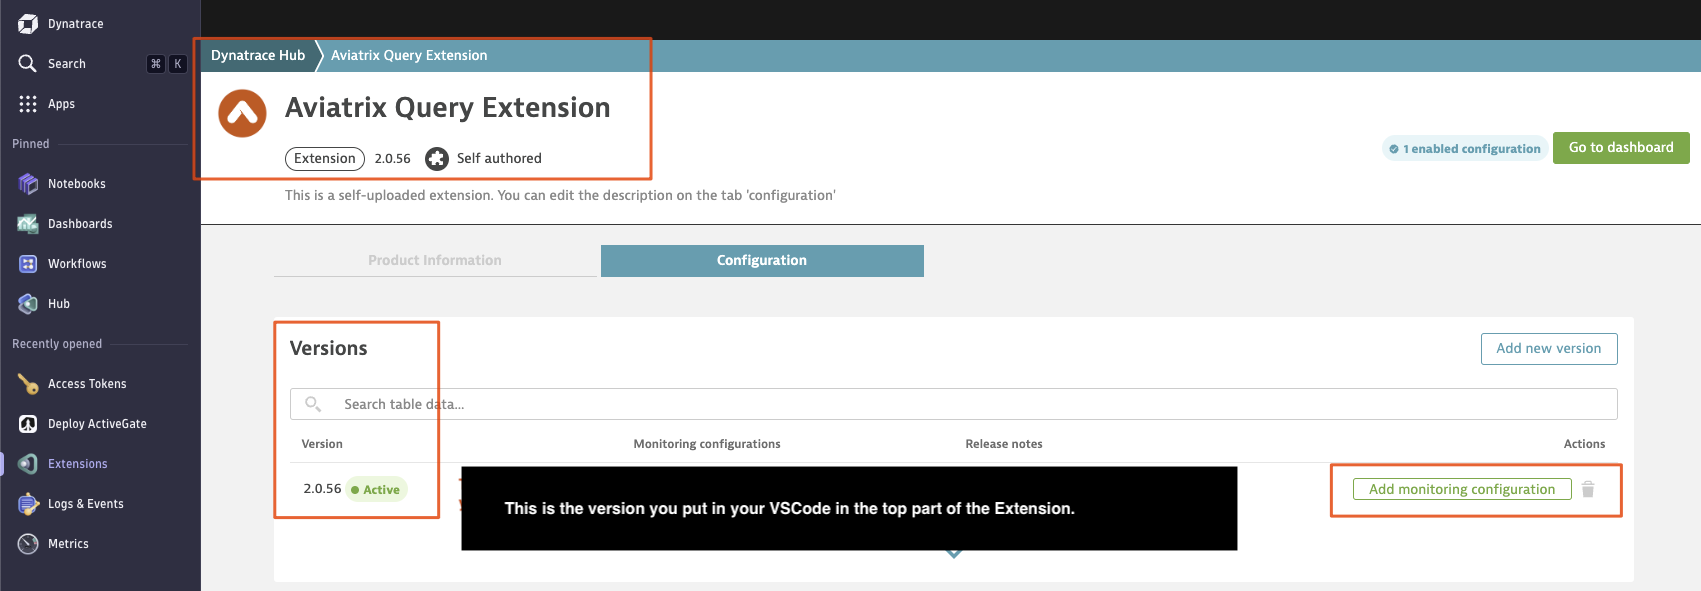
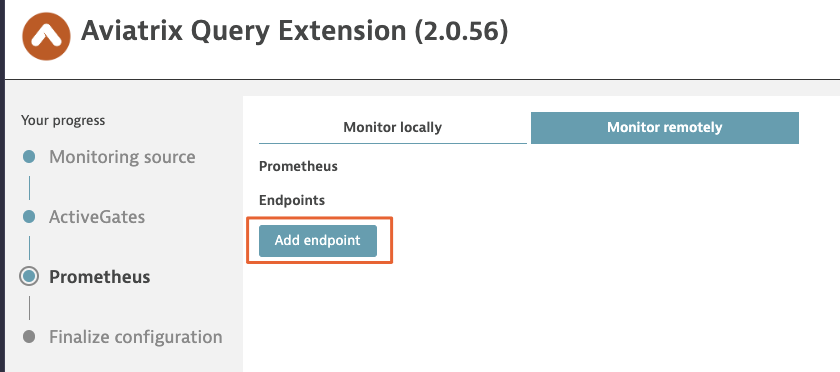
Click on that Add Monitoring config option
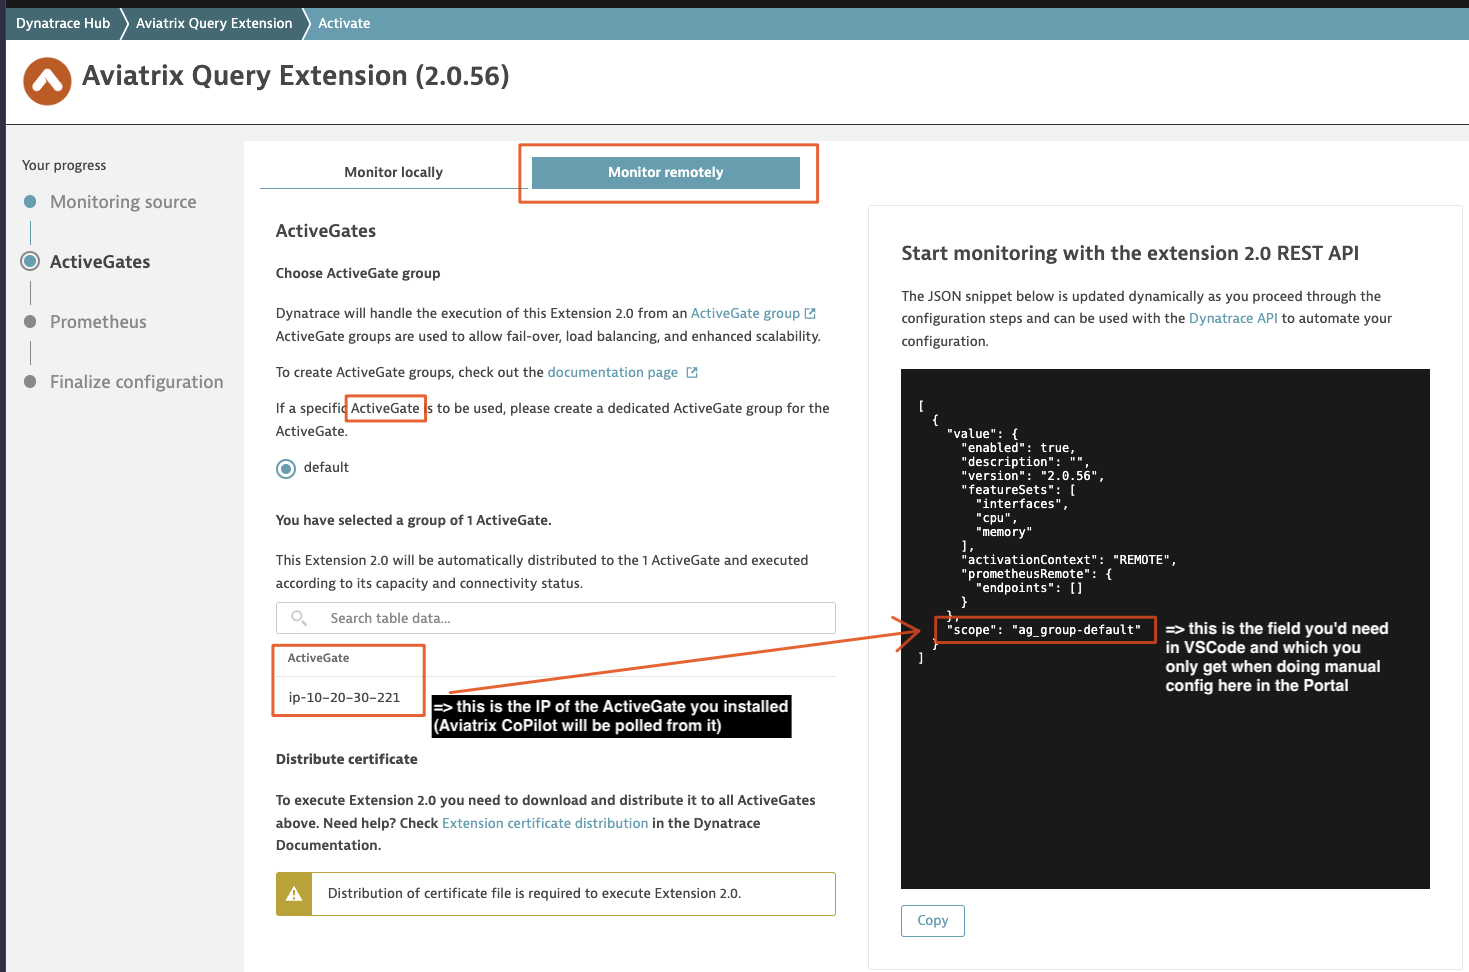
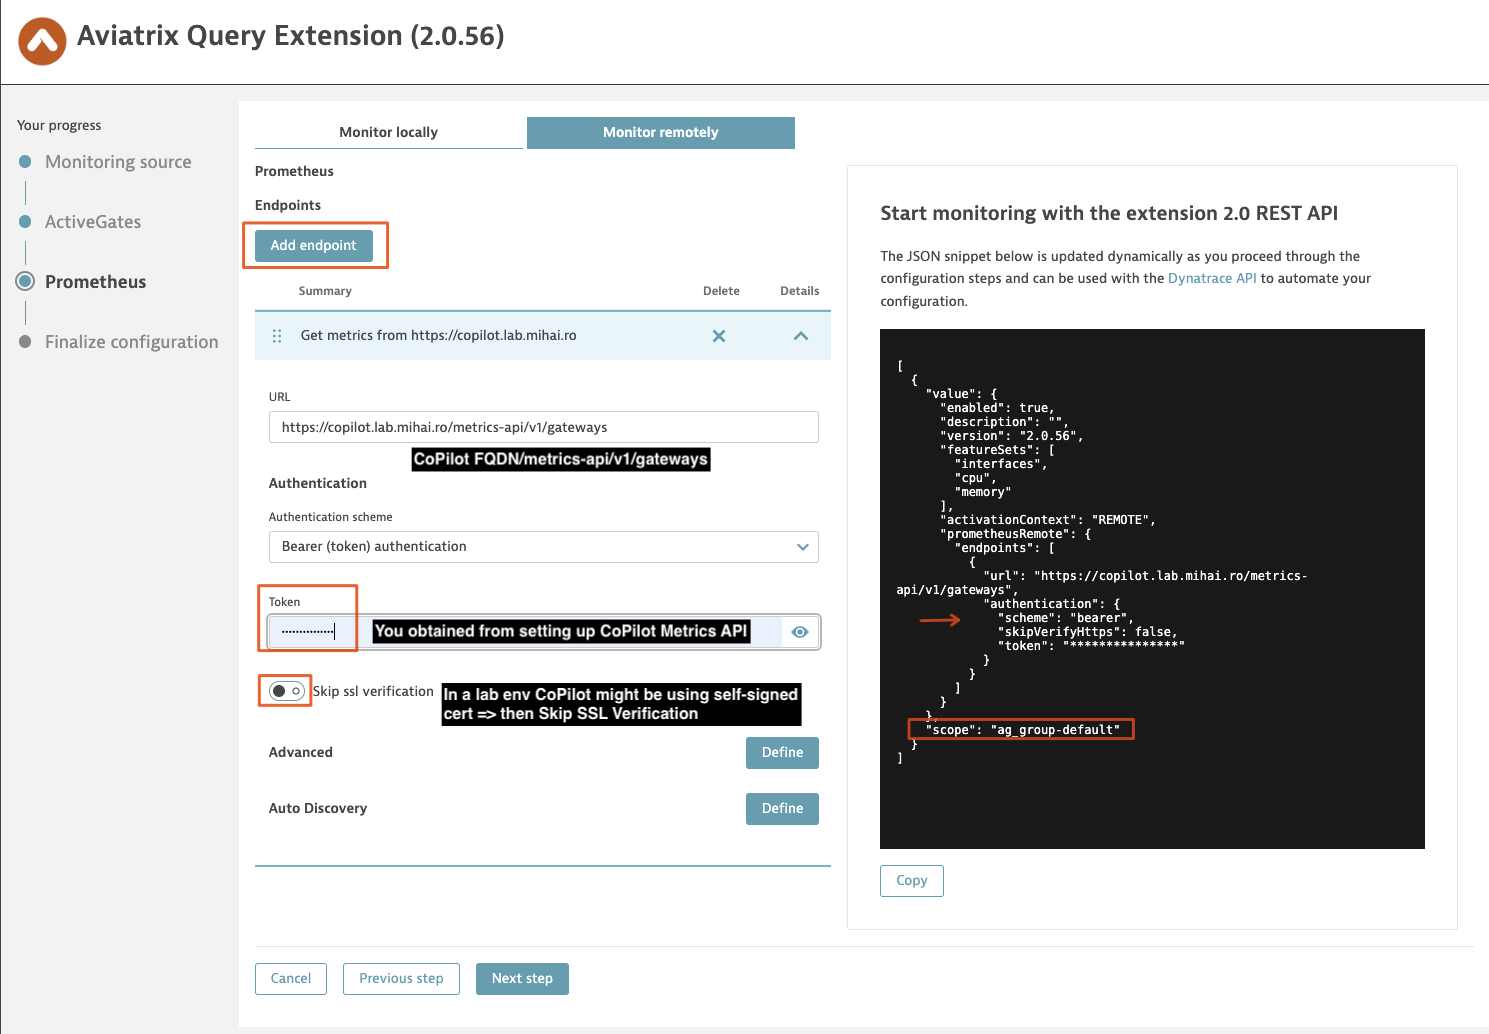
Add Prometheus Endpoint (Aviatrix CoPilot)
Configure CoPilot URL + API Token:
Configure FeatureSets (for which metric categories to poll CoPilot):
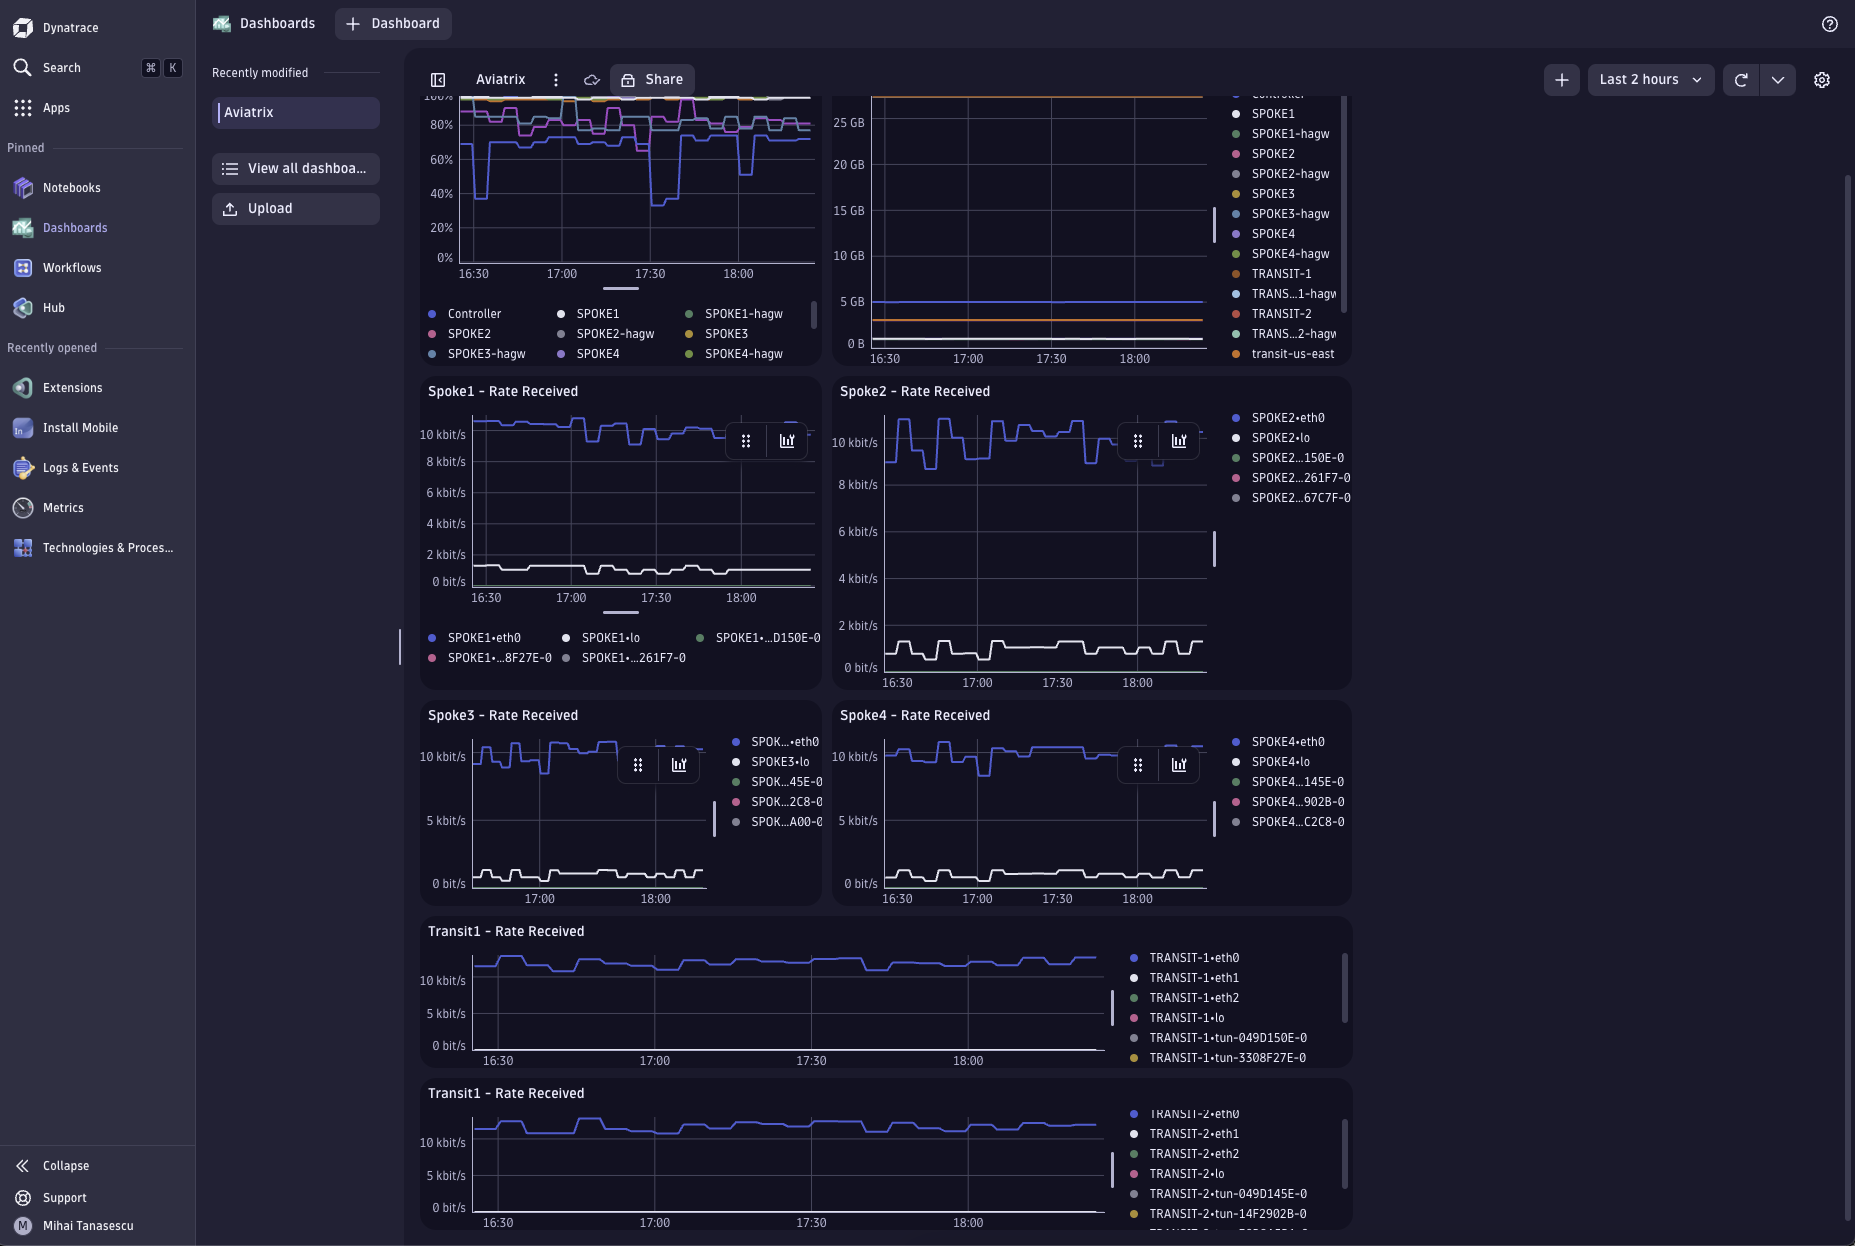
Create a Dashboard in Dynatrace
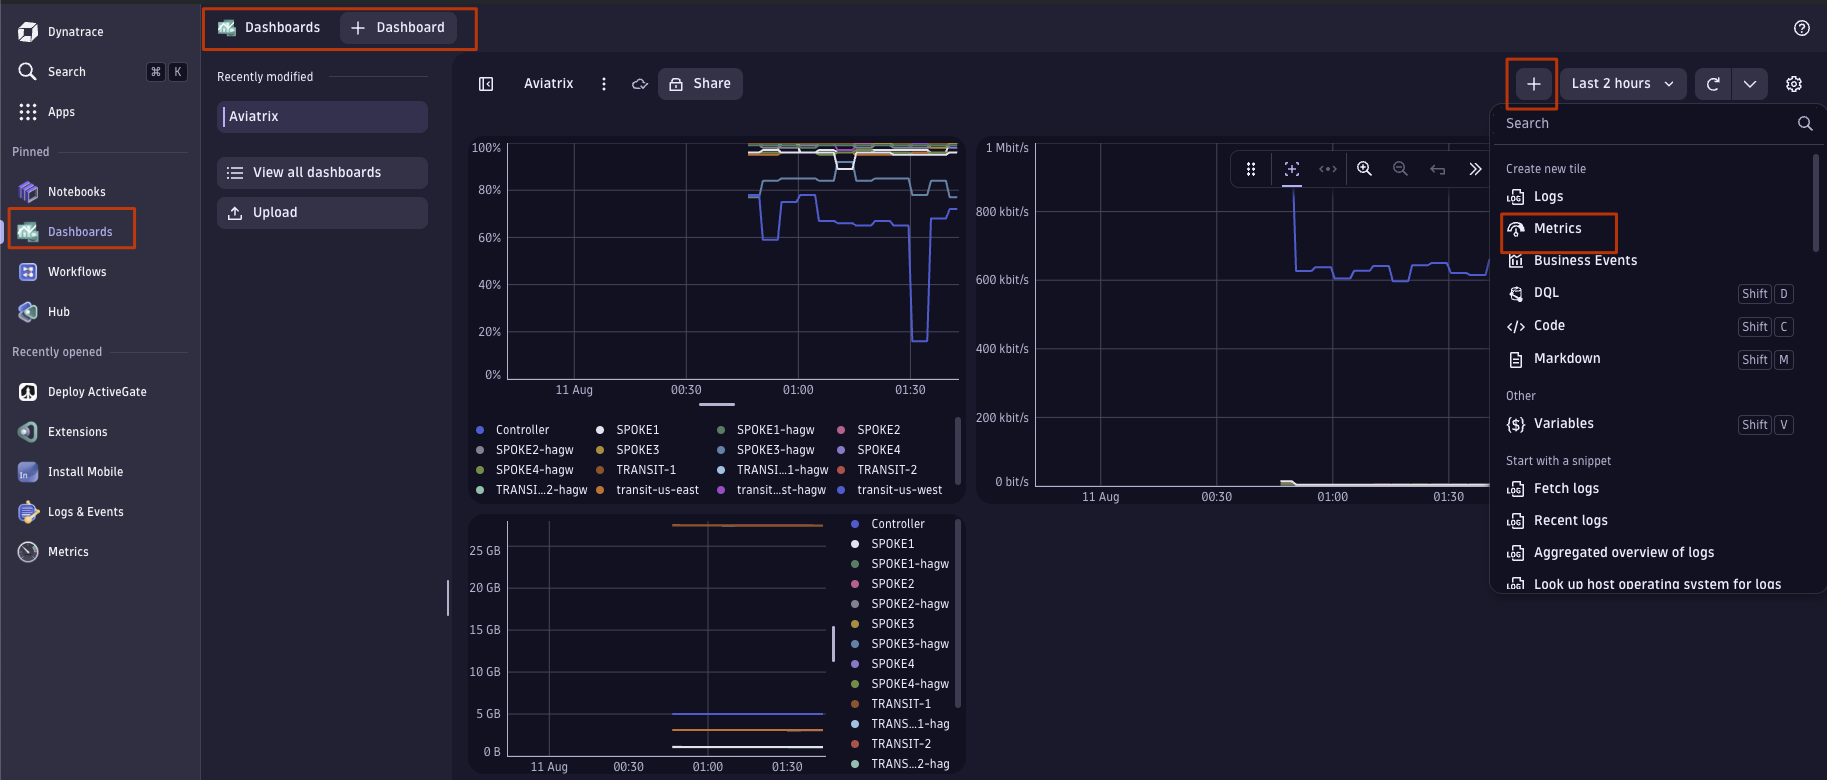
Dashboard - CPU/Memory/Rate Received
You just need to add the counters that are relevant to you.
Recommended Aviatrix Counters to Monitor
Troubleshoot
You can see what is happening in case of errors in VSCode
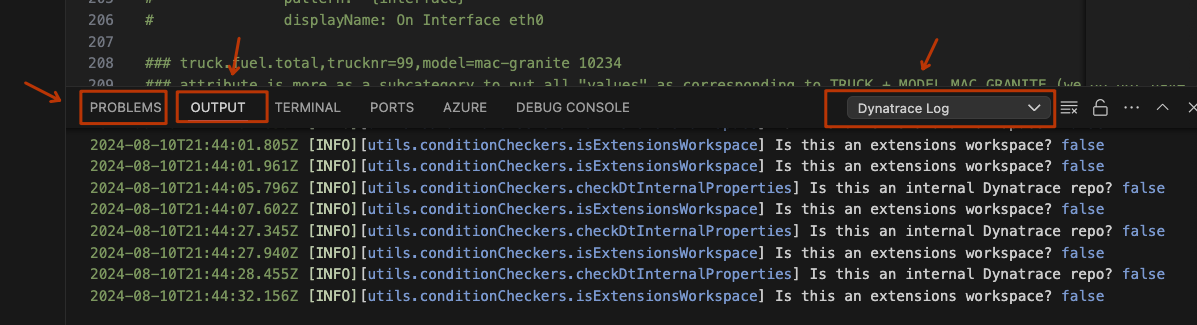
AND
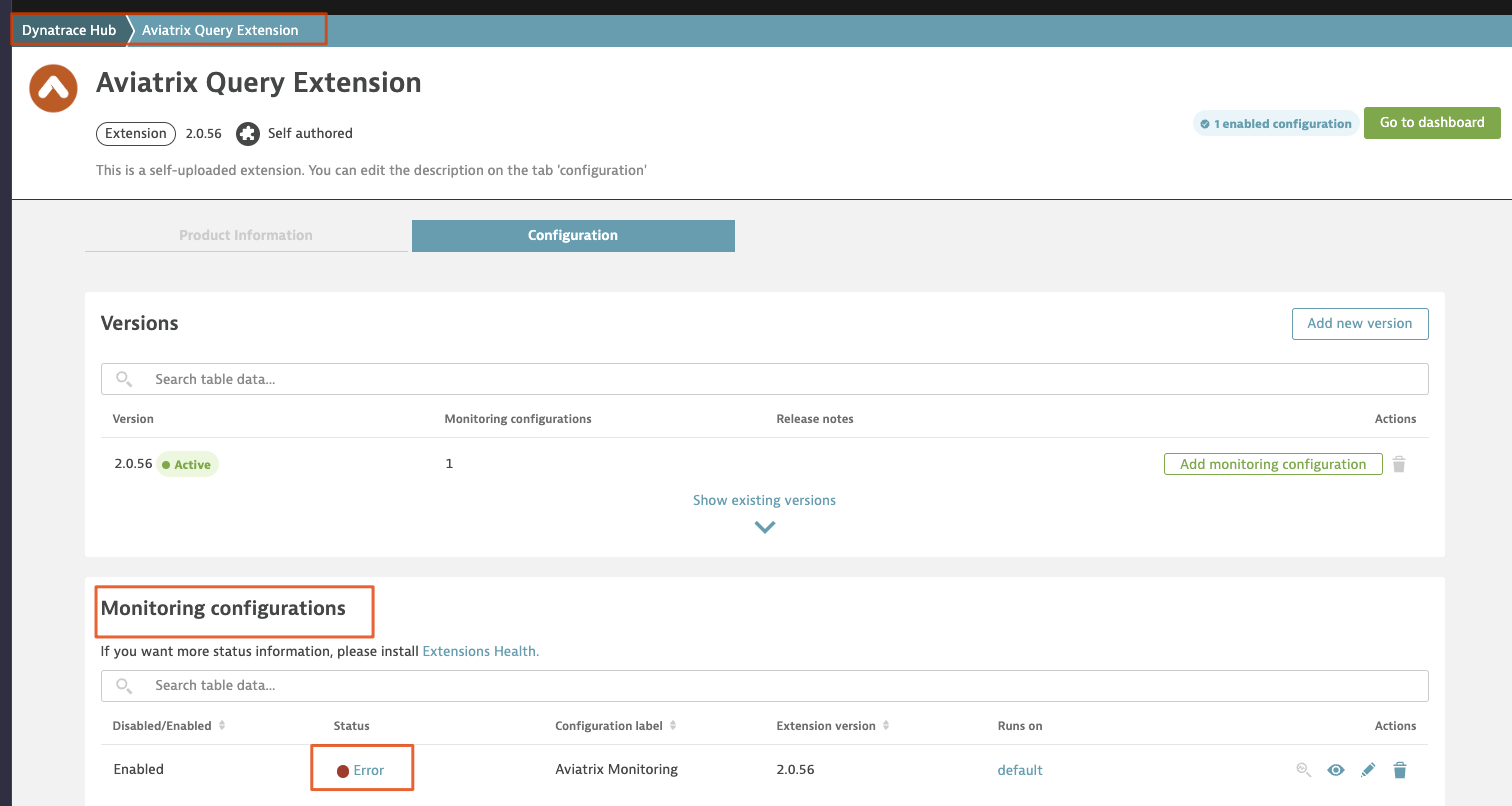
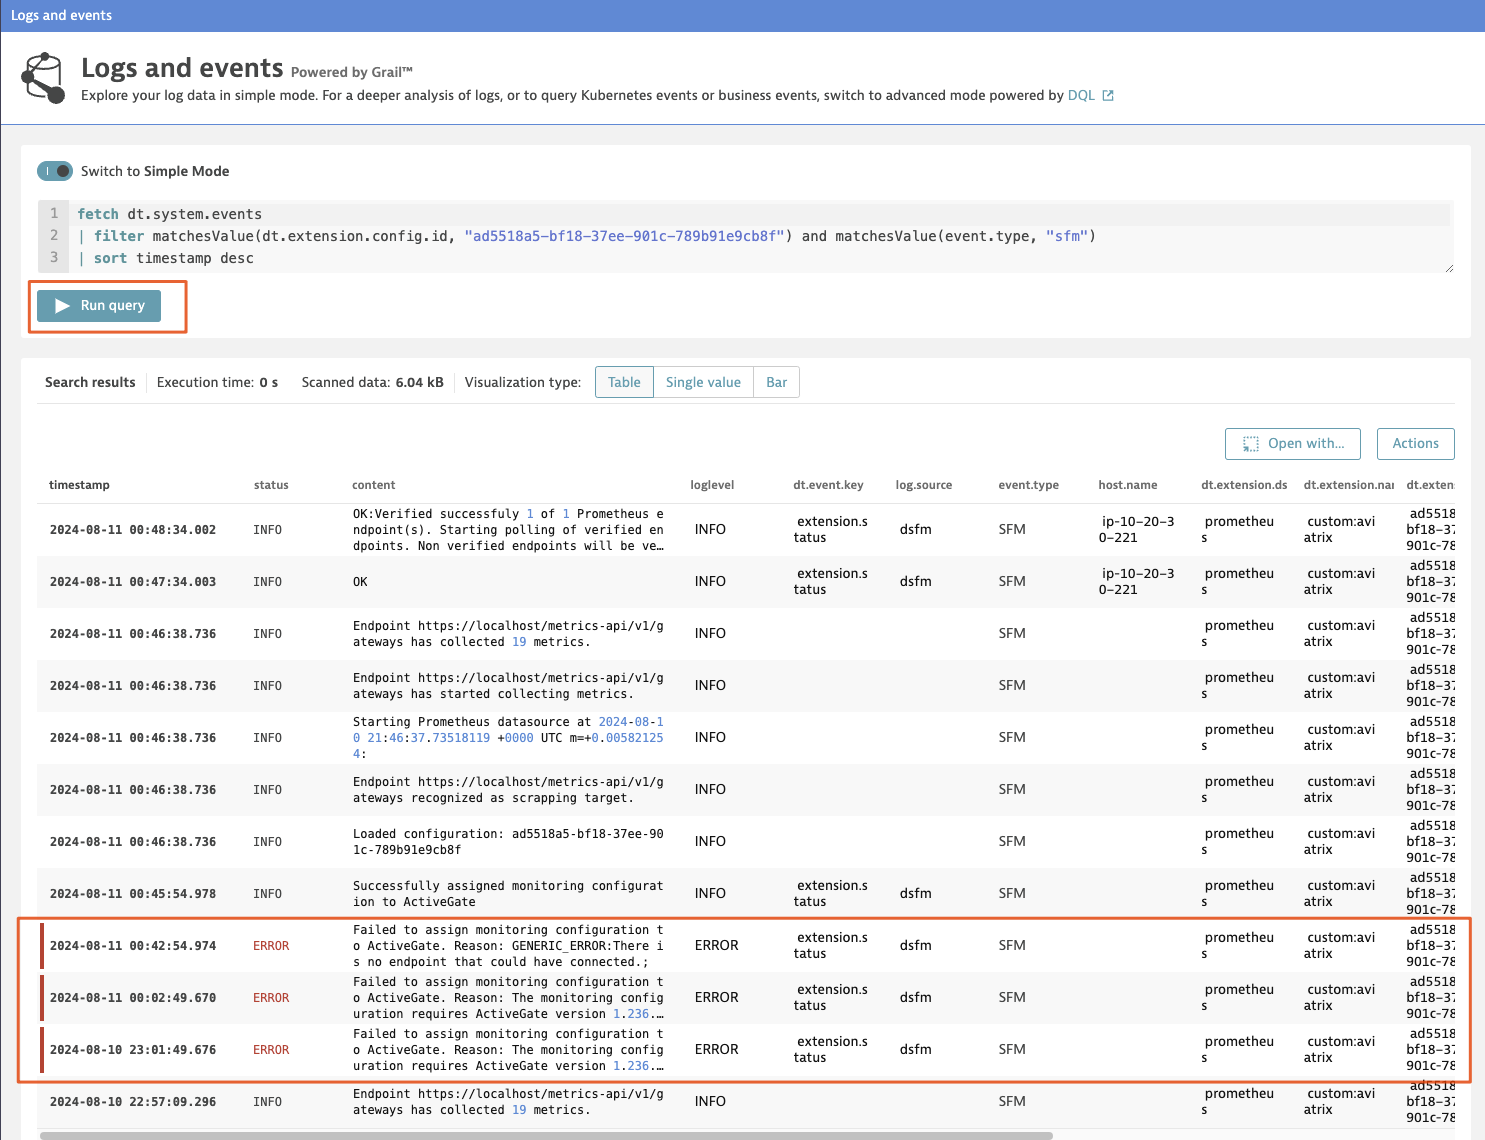
for metric/extension errors inside Dynatrace:
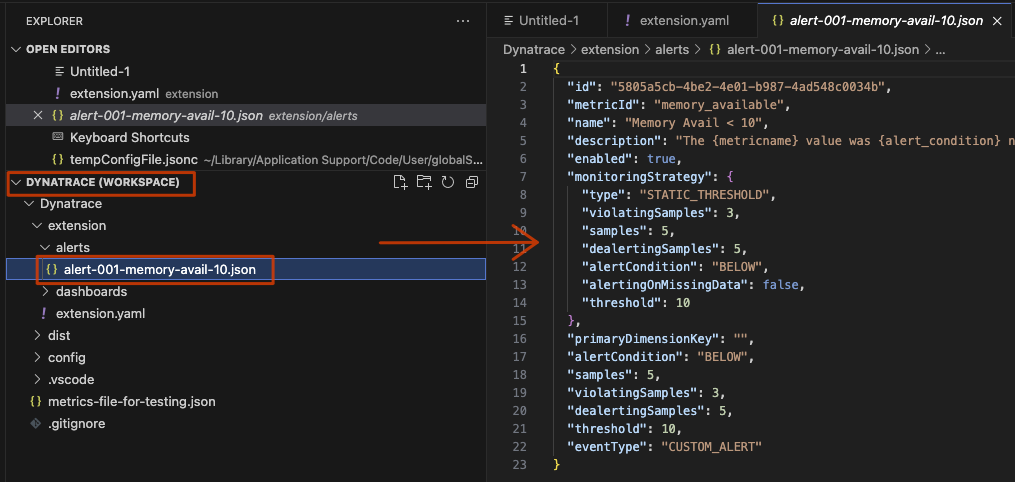
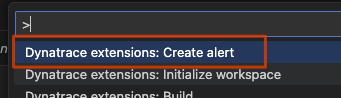
Extras: Create Alert from VSCode
On MacOSX press FN+F1, type Dynatrace, select Create Alert:
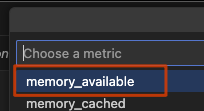
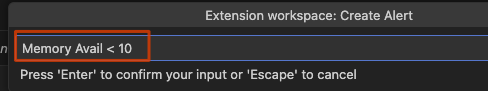
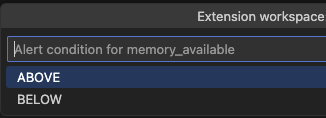
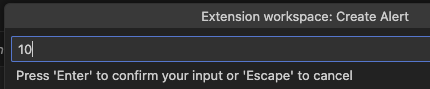
This results into creating the following json file:
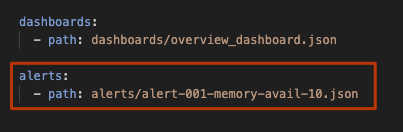
Based on how you see the file contents look, you can also use a script to generate this kind of content for each of your monitored metrics without having to go through all those menus from the Dynatrace VScode Plugin.